
|
Fig. 5
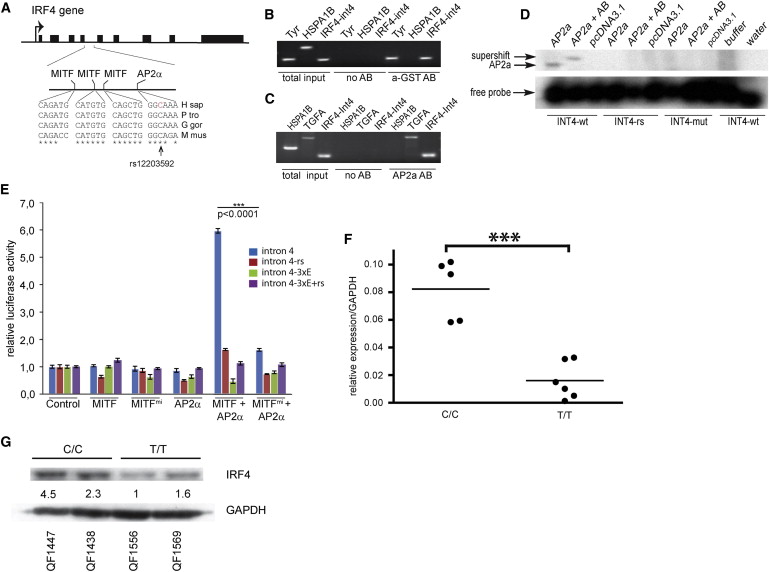
MITF and TFAP2A Affect IRF4 Expression by Binding Regulatory Elements in Intron 4
(A) Schematic view presents the IRF4 gene. The sequence shows a comparison of MITF- and TFAP2A-binding sites in intron 4 of IRF4 among humans (H sap [Homo sapiens]), gorilla (G gor [Gorilla gorilla]), chimpanzee (P tro [Pan troglodytes]), and mouse (M mus [Mus musculus]). The location of the rs12203592 polymorphism is indicated.
(B) ChIP analysis of a GST-tagged MITF protein (a-GST AB) was performed in 501mel cells. Primers specific for HSPA1B (negative control), TYR (positive control), and intron 4 of IRF4 are indicated. The GST-tagged Mitf only precipitated TYR and IRF4 sequences.
(C) ChIP analysis of TFAP2A in 501mel cells is presented. PCR products specific for TGFA (positive control), HSPA1B (negative control), and intron 4 of IRF4 are shown. TFAP2A only precipitated TGFA and INT4 sequences.
(D) Gel shift analysis shows the binding of TFAP2A to the ancestral sequence (INT4-WT) in intron 4 of IRF4 (coordinates chr6: 396309–396333 in build GRCh37.p5 of the human genome), but not to the rs12203592-T sequence (INT4-RS) or to a completely mutated sequence (INT4-mut).
(E) Luciferase reporter assays were performed in 501mel melanoma cells using intron 4 of IRF4 as a reporter. The ancestral IRF4 intron 4 sequence (intron 4, blue), the rs12203592-T polymorphic sequence (intron 4-rs), a sequence where all MITF-binding sites were mutated (intron 4-3xE), and a sequence containing mutated MITF sites and the rs12203592-T polymorphism (intron 4-3xE+rs) were tested. The luciferase reporters were cotransfected with the wild-type MITF and TFAP2A proteins and with a dominant-negative version of MITF (MITFmi). Statistical analysis was done using unpaired t test. Data are represented as mean ± SEM.
(F) Cells homozygous for the ancestral allele (CC) express significantly higher levels of IRF4 than cells homozygous for the rs12203592-T polymorphism (TT). Fold expression data are represented relative to pooled mean TT expression ± SEM. Statistical analysis was performed using ANOVA (p < 0.001).
(G) A western blot shows expression of the IRF4 protein in melanocytes from CC and TT individuals. Intensity quantification is relative to GAPDH-loading control. Note the decrease of basal IRF4 protein in the TT melanocyte cell lines.
See also Figures S3, S4, and S5.
Reprinted from Cell, 155(5), Praetorius, C., Grill, C., Stacey, S.N., Metcalf, A.M., Gorkin, D.U., Robinson, K.C., Van Otterloo, E., Kim, R.S., Bergsteinsdottir, K., Ogmundsdottir, M.H., Magnusdottir, E., Mishra, P.J., Davis, S.R., Guo, T., Zaidi, M.R., Helgason, A.S., Sigurdsson, M.I., Meltzer, P.S., Merlino, G., Petit, V., Larue, L., Loftus, S.K., Adams, D.R., Sobhiafshar, U., Emre, N.C., Pavan, W.J., Cornell, R., Smith, A.G., McCallion, A.S., Fisher, D.E., Stefansson, K., Sturm, R.A., and Steingrimsson, E., A Polymorphism in IRF4 Affects Human Pigmentation through a Tyrosinase-Dependent MITF/TFAP2A Pathway, 1022-1033, Copyright (2013) with permission from Elsevier. Full text @ Cell