
IMAGE
Fig. S1
- ID
- ZDB-IMAGE-140219-33
- Publication
- Chen et al., 2013 - zebraflash transgenic lines for in vivo bioluminescence imaging of stem cells and regeneration in adult zebrafish
- All Figures
- Figures for Chen et al., 2013
Image
|
Figure Caption
Fig. S1
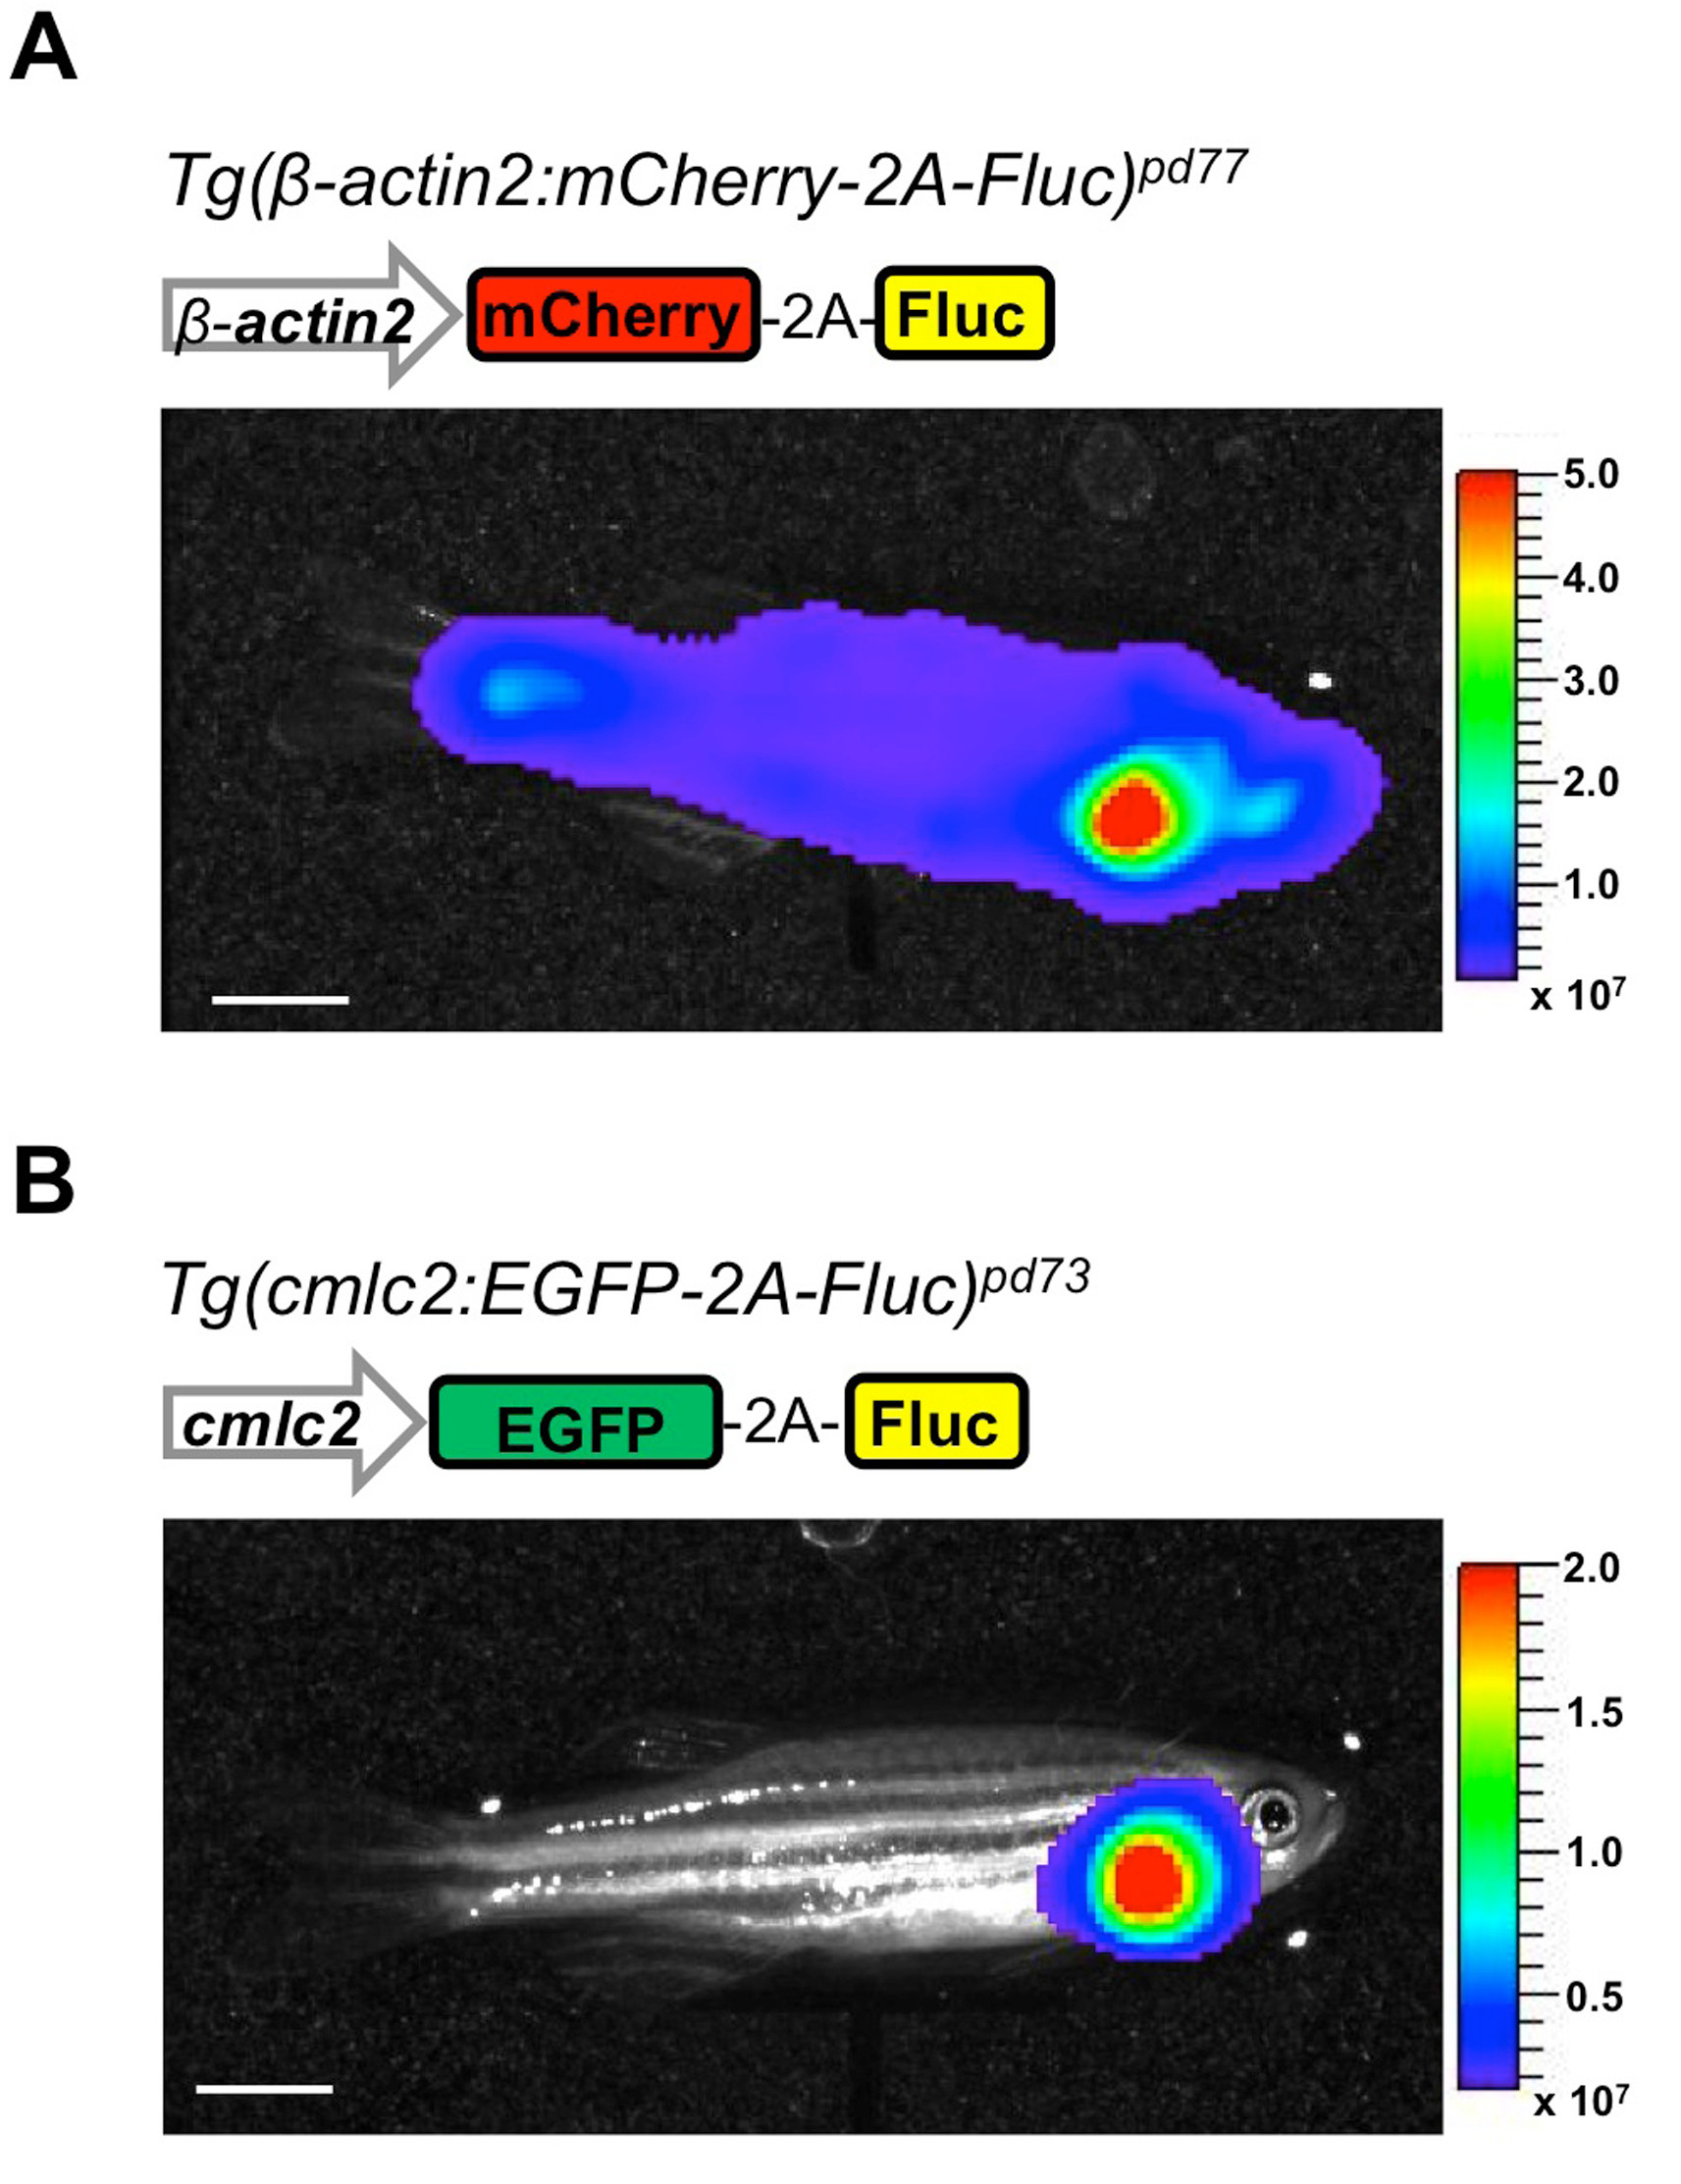
Additional transgenic lines generated in this study. (A,B) Representative bioluminescence images showing the lateral view of a β-actin2:mCherry-2A-Fluc fish (A) and a cmlc2:EGFP-2A-Fluc fish (B). Scale bars, 5 mm.
Acknowledgments
This image is the copyrighted work of the attributed author or publisher, and
ZFIN has permission only to display this image to its users.
Additional permissions should be obtained from the applicable author or publisher of the image.
Full text @ Development