
Fig. 4
- ID
- ZDB-IMAGE-140214-10
- Publication
- Dheen et al., 1999 - Zebrafish tbx-c functions during formation of midline structures
- All Figures
- Figures for Dheen et al., 1999
|
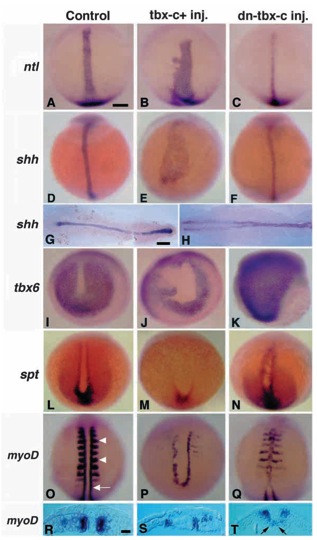
Fig. 4 Effects of ectopic expression of tbx-c+ and dn-tbx-c in zebrafish embryos at 10 hpf. For each marker, control embryos injected with lacZ mRNA, tbx-c+ embryos and dn-tbx-c embryos were included. (A-H) Expansion of the notochord in tbx-c+ embryos (B,E) and attenuation of the notochord in dn-tbx-c embryos (C,F) are shown by expression of ntl and shh. Dorsal view of a flat-mounted control (G) as well as tbx-c+ (H) embryos show that overexpression of tbx-c+ causes bifurcation of anterior midline (H). (I-K) tbx6 expression in the lateral mesoderm (I) is reduced in tbx-c+ embryos (J) and expanded to the midline in dn-tbx-c embryos (K). (L-N) spt expression (L) like tbx6, is reduced in the lateral mesoderm of tbx-c+ embryos (M) and expanded in dn-tbx-c embryos (N). (OT) myoD is expressed in adaxial (arrow) and paraxial (arrowheads) cells (O). Its expression reveals a reduction of somitic tissue in tbx-c+ embryos (P,S) and fusion of somites at the midline in dn-tbx-c embryos (Q,T). Transverse sections reveal that the midline is expanded about 2.5-fold in tbx-c+ embryos (P,S) in comparison to that of the control (O,R). In contrast, the midline mesoderm is reduced and myoD-positive muscle cells appear in the midline of dn-tbx-c embryos (arrows; T). Scale bars, 100 μm (A-Q), 25 μm (R-T).