
Fig. 4
- ID
- ZDB-IMAGE-140124-6
- Genes
- Antibodies
- Publication
- Matsuda et al., 2013 - Aldh1-expressing endocrine progenitor cells regulate secondary islet formation in larval zebrafish pancreas
- All Figures
- Figures for Matsuda et al., 2013
|
Fig. 4
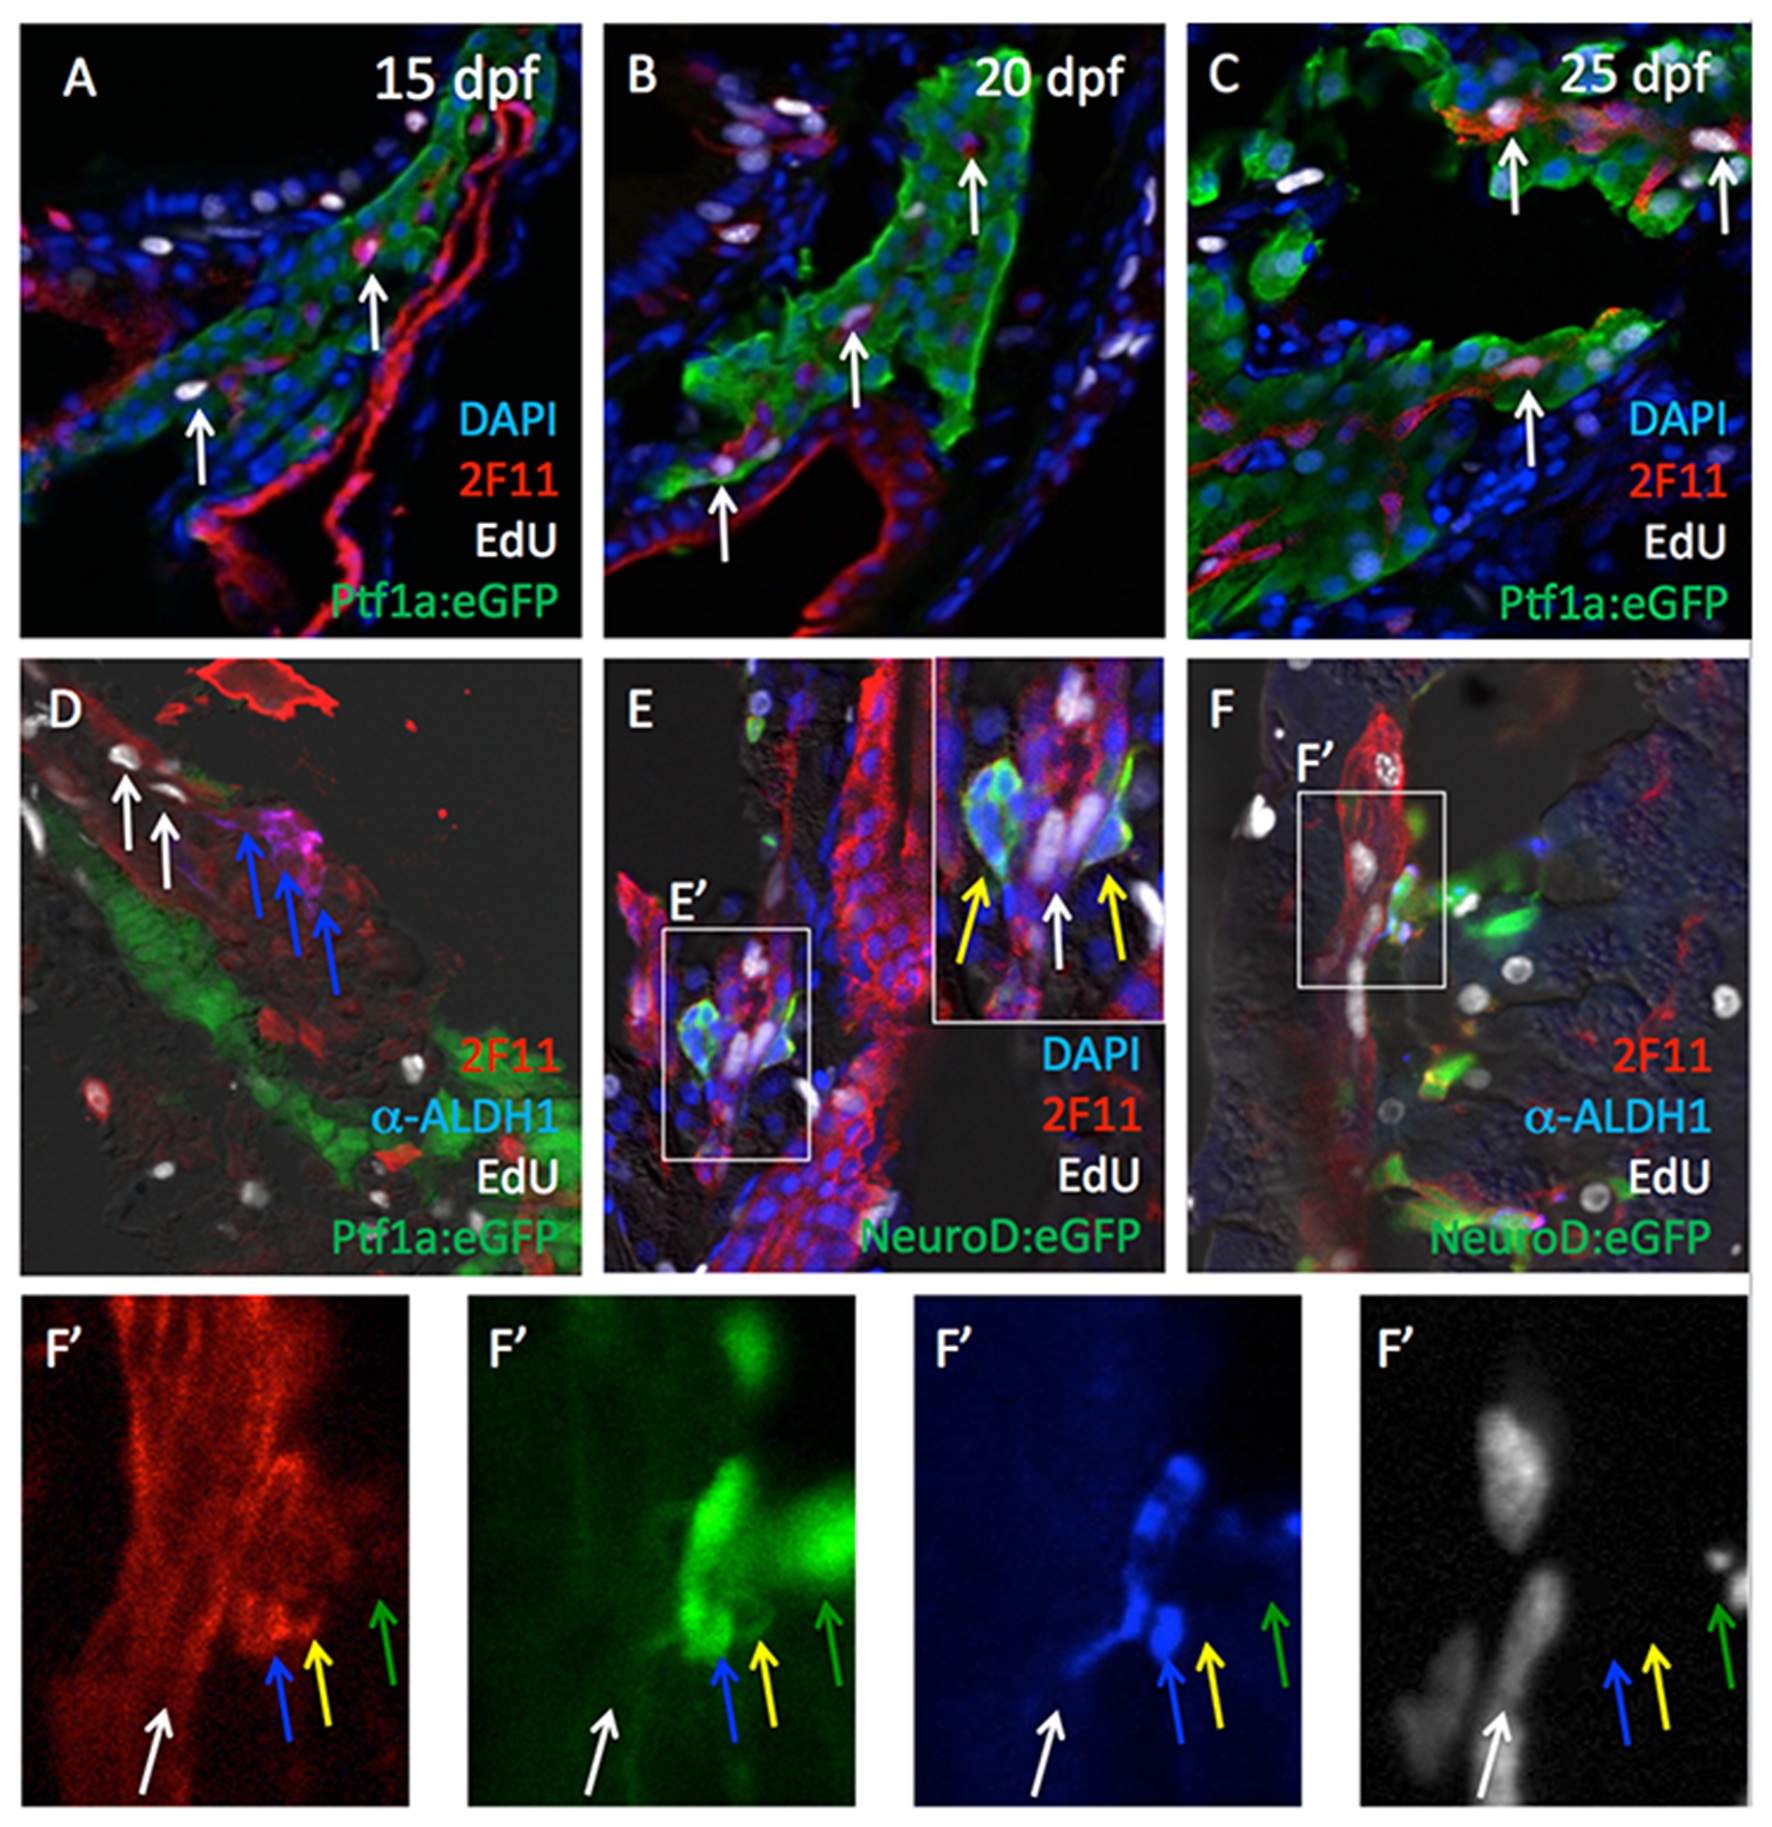
Cell proliferation among Aldh1- and 2F11-expressing cells.
EdU signals (white arrows) were detected in subsets 2F11pos cells at 15 (A), 20 (B) and 25 dpf (C). (D) Cells co-expressing Aldh1 and 2F11 (blue arrows) are not proliferative, but are localized in the adjacent to Aldh1-negative, EdUpos, 2F11pos cells (white arrows). (E and E′) Cells co-expressing NeuroD and 2F11 (yellow arrows) are not proliferative but are localized adjacent to NeuroD:eGFP-negative, EdUpos, 2F11pos cells (white arrows). (F and F′) Detailed geometry of 2F11, Aldh1, NeuroD:eGFP expression in association with EdU incorporation. White arrows indicate EdU pos/2F11 pos/Aldh1 neg/NeuroD:eGFPneg cells. Blue arrows indicate EdUneg /2F11 pos/Aldh1 pos/NeuroD:eGFPpos cells. Yellow arrows indicate EdU neg/2F11 pos/Aldh1 neg/NeuroD:eGFPpos cells. Green arrows indicate EdU neg/2F11neg /Aldh1 neg/NeuroD:eGFPpos cells.