
Fig. 1
- ID
- ZDB-IMAGE-140124-3
- Genes
- Publication
- Matsuda et al., 2013 - Aldh1-expressing endocrine progenitor cells regulate secondary islet formation in larval zebrafish pancreas
- All Figures
- Figures for Matsuda et al., 2013
|
Fig. 1
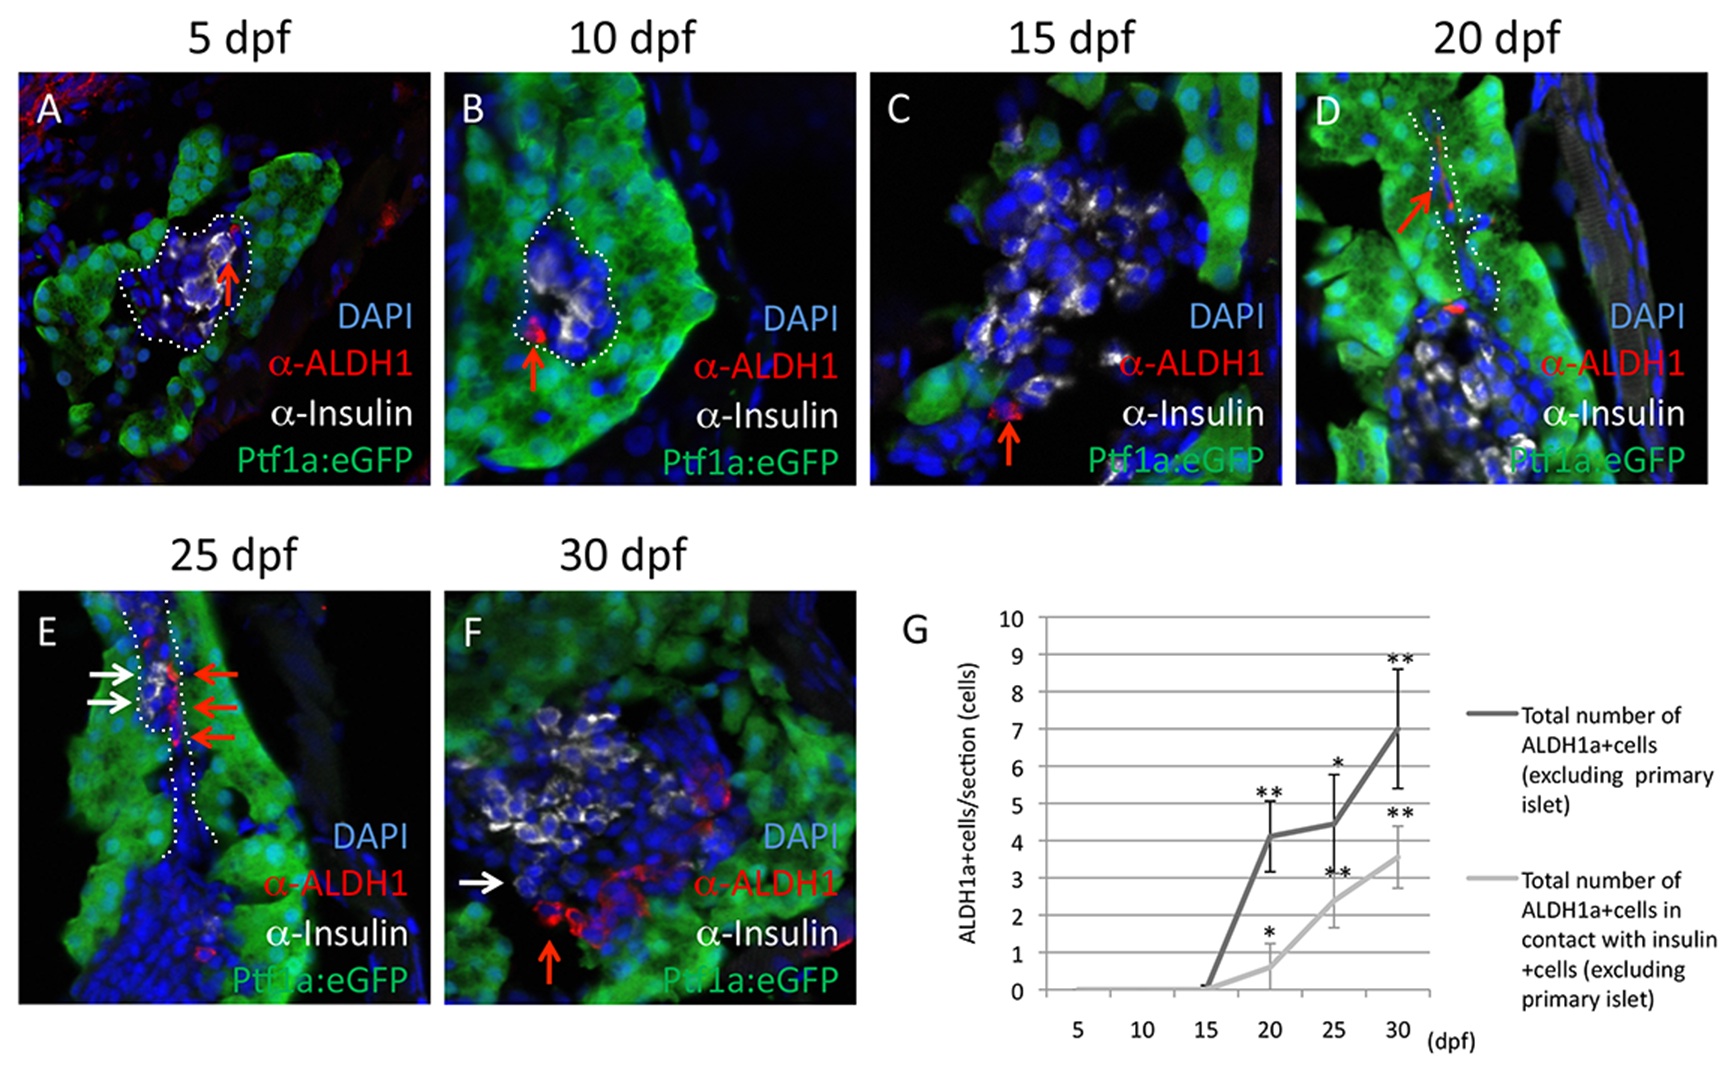
Aldh1-expressing cells increase in number and are spatially associated with endocrine cells during secondary islet formation.
Expression of Aldh1 (red arrows) is compared with that of Insulin (white arrows), as assessed immunofluorescent labeling at 5 (A), 10 (B), 15 (C), 20 (D), 25 (E) and 30 dpf (F). (G) Quantification of the number of Aldh1-expressing cells located outside of the principle islet (black line), and their juxtaposition with Insulin-expressing cells (grey line). Values were derived from n=10 fish per developmental time point, with a minimum of 3 sections per fish. (*) and (**) indicate p<0.05 and p<0.01, respectively. Dotted white lines in (A) and (B) indicate region of principle islet; dotted white lines in (D) and (E) indicate region of pancreatic duct.