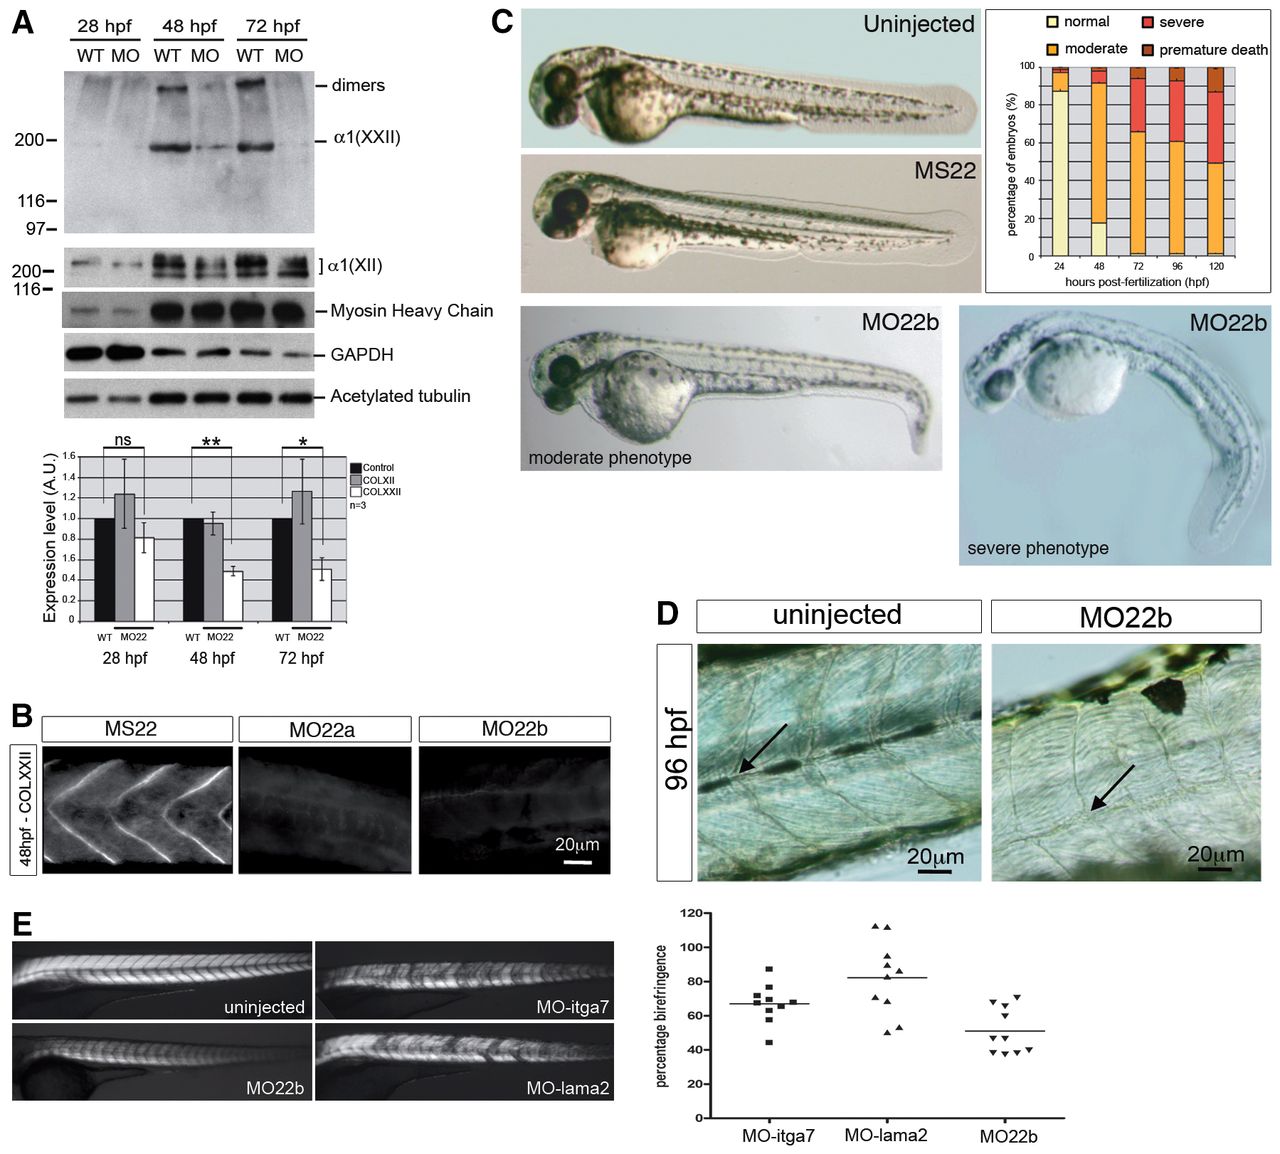
Fig. 2 Morpholino knockdown of col22a1 in developing zebrafish. (A,B) Efficacy, specificity and functional duration of col22a1 morpholino-knockdown in developing embryos. (A) Western blots of MO22b-injected (MO) and uninjected (WT) embryo protein extracts with antibodies to COLXXII, myoseptal marker COLXII or myosin heavy chain. Loading controls are GAPDH and acetylated tubulin. Data from one representative experiment are shown. Histogram shows densitometric quantification of relative COLXXII and COLXII expression levels normalized to acetylated tubulin. Data are mean±s.e.m. (n=3), *P<0.05, **P<0.01. (B) Immunofluorescence with antibodies to COLXXII of 48 hpf embryos injected with MO22a, MO22b and five-base mismatch morpholino (MS22). Scale bars: 20 μm. (C,D) Light microscopy analysis of the phenotype. (C) Representative images of 48 hpf uninjected embryos, embryos injected with control MS22, and moderate and severe phenotypes of col22a1 morphants (MO22b). Histogram shows percentage of MO22-injected larvae displaying no, moderate or severe phenotypes at different developmental stages (n=250; number of injections=3). (D) U-shaped somites of 96 hpf MO-injected larvae (MO22b) compared with the V-shape somites of uninjected larvae (arrows). Scale bars: 20 μm. (E) Birefringence of 4 dpf MO22-injected larvae. Representative images of larvae injected with morpholinos against col22a1 (MO22, moderate phenotype), lama2 (MO-lama2) and itga7 (MO-itga7) compared with uninjected larvae. Quantification of birefringence measurements. Values represent mean birefringence normalized to uninjected larvae. Anterior is towards the left.
Image
Figure Caption
Figure Data
Acknowledgments
This image is the copyrighted work of the attributed author or publisher, and
ZFIN has permission only to display this image to its users.
Additional permissions should be obtained from the applicable author or publisher of the image.
Full text @ Development

