
IMAGE
Fig. S2
- ID
- ZDB-IMAGE-140114-16
- Publication
- Corallo et al., 2013 - Emilin3 is required for notochord sheath integrity and interacts with Scube2 to regulate notochord-derived Hedgehog signals
- All Figures
- Figures for Corallo et al., 2013
Image
|
Figure Caption
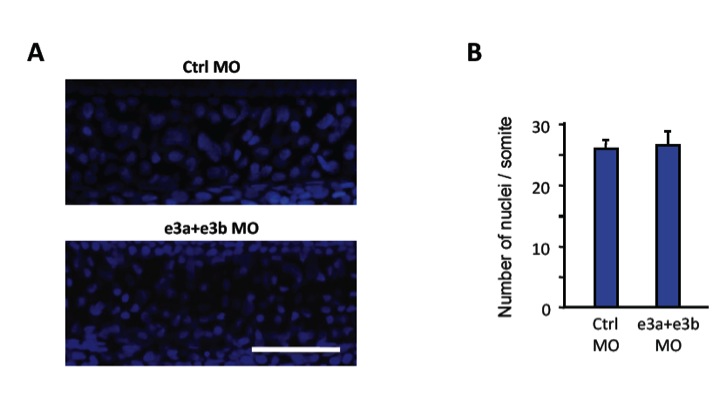
Fig. S2 Quantification of the mean number of notochord cells. (A) Notochord cell nuclei of the same trunk region from 24 hpf control and Emilin3 double morphant embryos were stained with Hoechst. Scale bar, 50 μm. (B) Nuclei, stained as in (A), were counted and reported as mean number of nuclei/somite (not significant; n=15). Ctrl MO, control morpholino; e3a+e3b MO, emilin3a + emilin3b morpholinos.
Acknowledgments
This image is the copyrighted work of the attributed author or publisher, and
ZFIN has permission only to display this image to its users.
Additional permissions should be obtained from the applicable author or publisher of the image.
Full text @ Development