
|
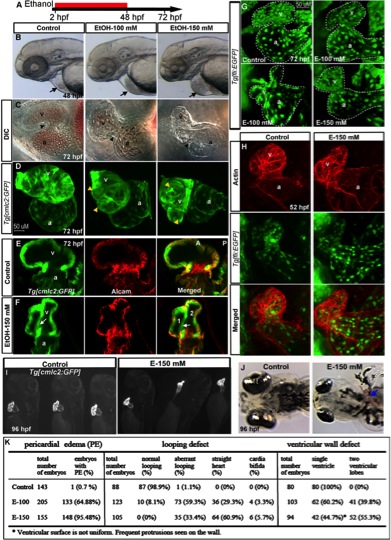
Fig. 1 Chronic ethanol exposure during cardiogenesis severely disrupts heart formation. A: Schematic diagram showing the developmental timing (2–48 hpf) of ethanol exposure. B, C: Live images showed pericardial edema (arrows) (B), and smaller, misshapen chambers with aberrant AV canal (arrowheads) in the ethanol-treated embryos (C). D, G: 3D renderings of confocal sections of Tg[cmlc2:GFP] and Tg[fli1:EGFP] embryos showing distorted myocardium, multilobed ventricle (D), and misshapen endocardium (G) in ethanol-exposed embryos. Yellow arrowheads, multiple lobes. E, F: Single confocal sections at the AV boundary of alcam-stained Tg[cmlc2:GFP] embryos showing a single ventricle in the control and two ventricular lobes (1 and 2) in the ethanol-treated embryo. White arrows, abnormal additional ventricular wall connection. H: 3D Confocal images of Texas red phalloidin–stained Tg[fli1:EGFP] embryos showing defective endocardium corresponding to the myocardium in ethanol exposed embryos. I, J: Brightfield live images of Tg[cmlc2:GFP] embryos showed abnormal heart (I) and blood clot (J; blue arrow) at 96 hpf in ethanol-exposed embryos. K: Scores showing the effect of ethanol on cardiac development (results from three individual experiments). Mantel-Haenszel chi-square tests: PE, P < 0.0001; looping defect, P < 0.0001; ventricular wall defect, P < 0.0001. a, atrium; v, ventricle. Anterior to the left (B–H, J), anterior to the top (I).