
IMAGE
Fig. 5
- ID
- ZDB-IMAGE-131218-50
- Publication
- Cavodeassi et al., 2013 - Eph/Ephrin signalling maintains eye field segregation from adjacent neural plate territories during forebrain morphogenesis
- All Figures
- Figures for Cavodeassi et al., 2013
Image
|
Figure Caption
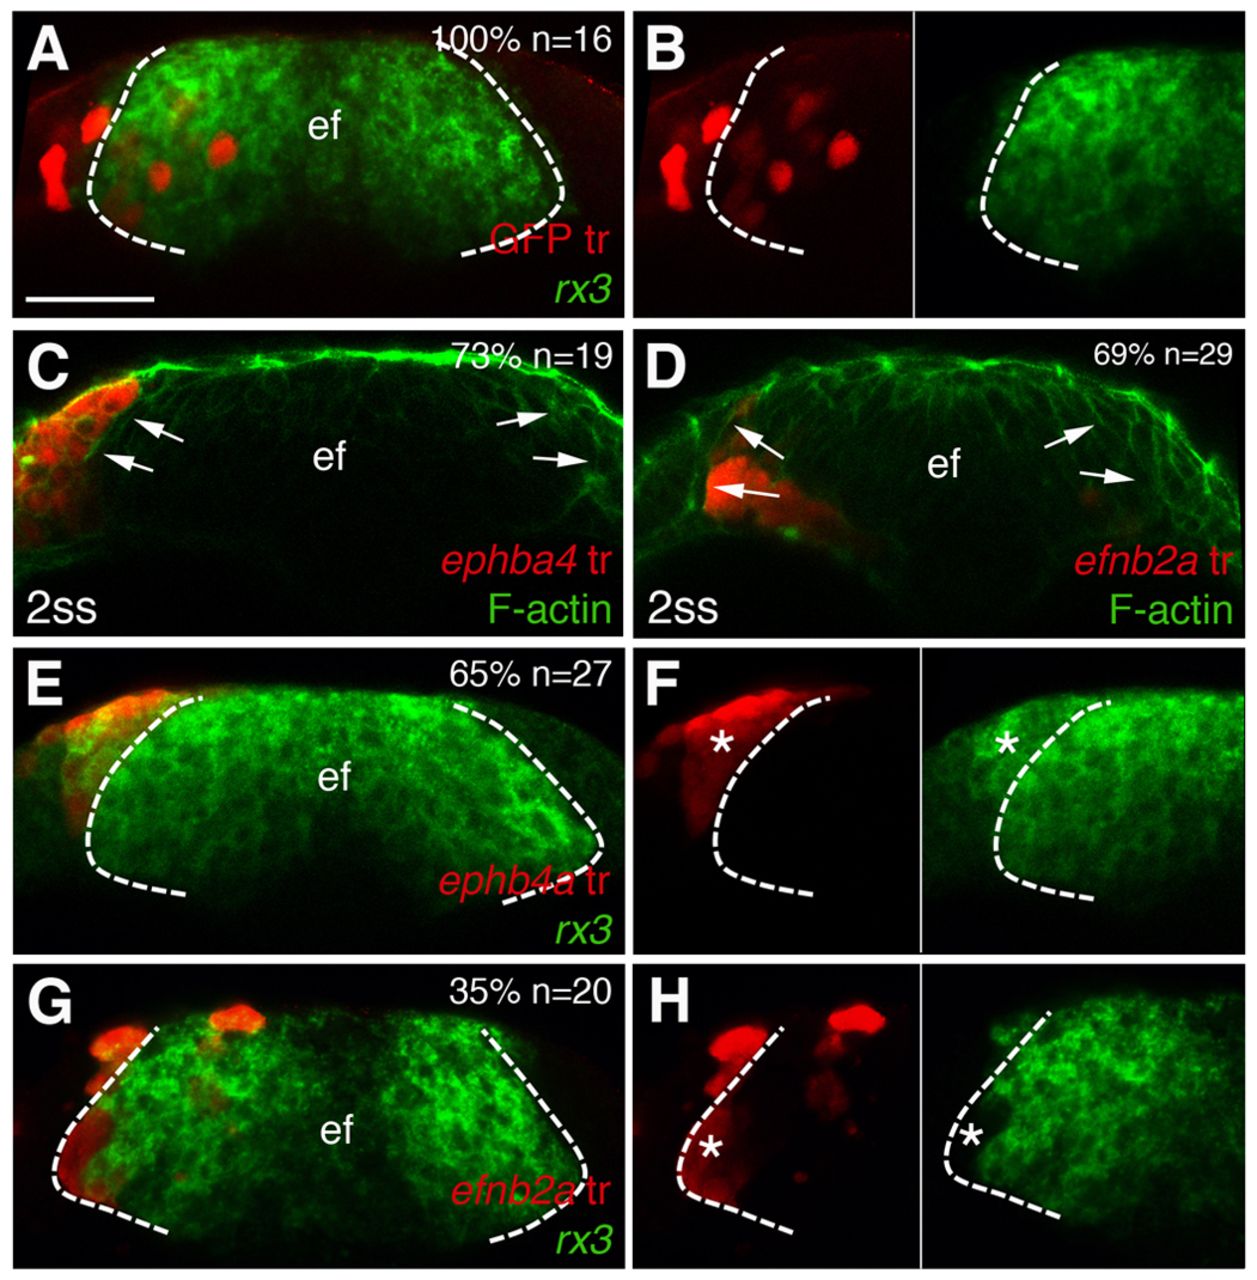
Fig. 5 Eph/Ephrin expression influences the segregation of cells between ANP domains. (A-H) Frontal views through the forebrain showing transplants of cells expressing GFP (A,B), ephb4a (C,E,F) or efnb2a (D,G,H) at 1-2 ss, treated to detect rx3 expression in the eye field (A,B,E-H) or accumulation of F-actin at the eye/telencephalic boundary (C,D). Dashed lines (A,B,E-H) demarcate the eye field (ef); arrows (C,D) point at the boundary of the eye. Asterisks (F,H) highlight the transplanted cells. F and H show details from panels E and G, respectively. Scale bars: 50 μm.
Acknowledgments
This image is the copyrighted work of the attributed author or publisher, and
ZFIN has permission only to display this image to its users.
Additional permissions should be obtained from the applicable author or publisher of the image.
Full text @ Development