
Image
|
Figure Caption
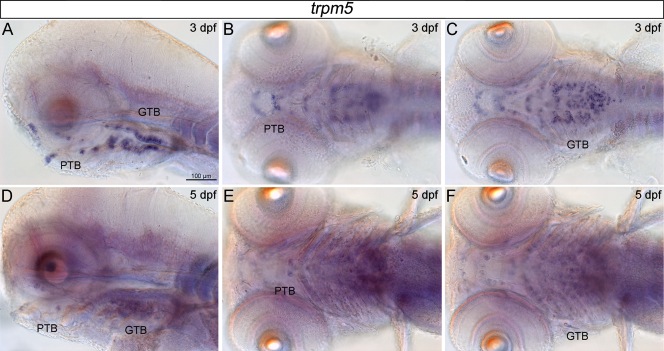
Fig. 6 Expression of trpm5 in taste bud cells during zebrafish development. A–C: Lateral (A) and ventral (B,C) whole-mount views of larvae 3 days post fertilization (dpf). D–F: Lateral (D) and ventral (E,F) whole-mount views of larvae staged 5 dpf, with anterior to the left in all pictures. Scale bars of 100 μm are indicated in A for all pictures shown. PTB, pharynx taste bud; GTB, gill taste bud.
Figure Data
Acknowledgments
This image is the copyrighted work of the attributed author or publisher, and
ZFIN has permission only to display this image to its users.
Additional permissions should be obtained from the applicable author or publisher of the image.
Full text @ Dev. Dyn.