
Fig. 2
- ID
- ZDB-IMAGE-131210-7
- Genes
- Publication
- Jones et al., 2013 - Modelling human Wiskott-Aldrich syndrome protein mutants in zebrafish larvae using live in vivo imaging
- All Figures
- Figures for Jones et al., 2013
|
Fig. 2
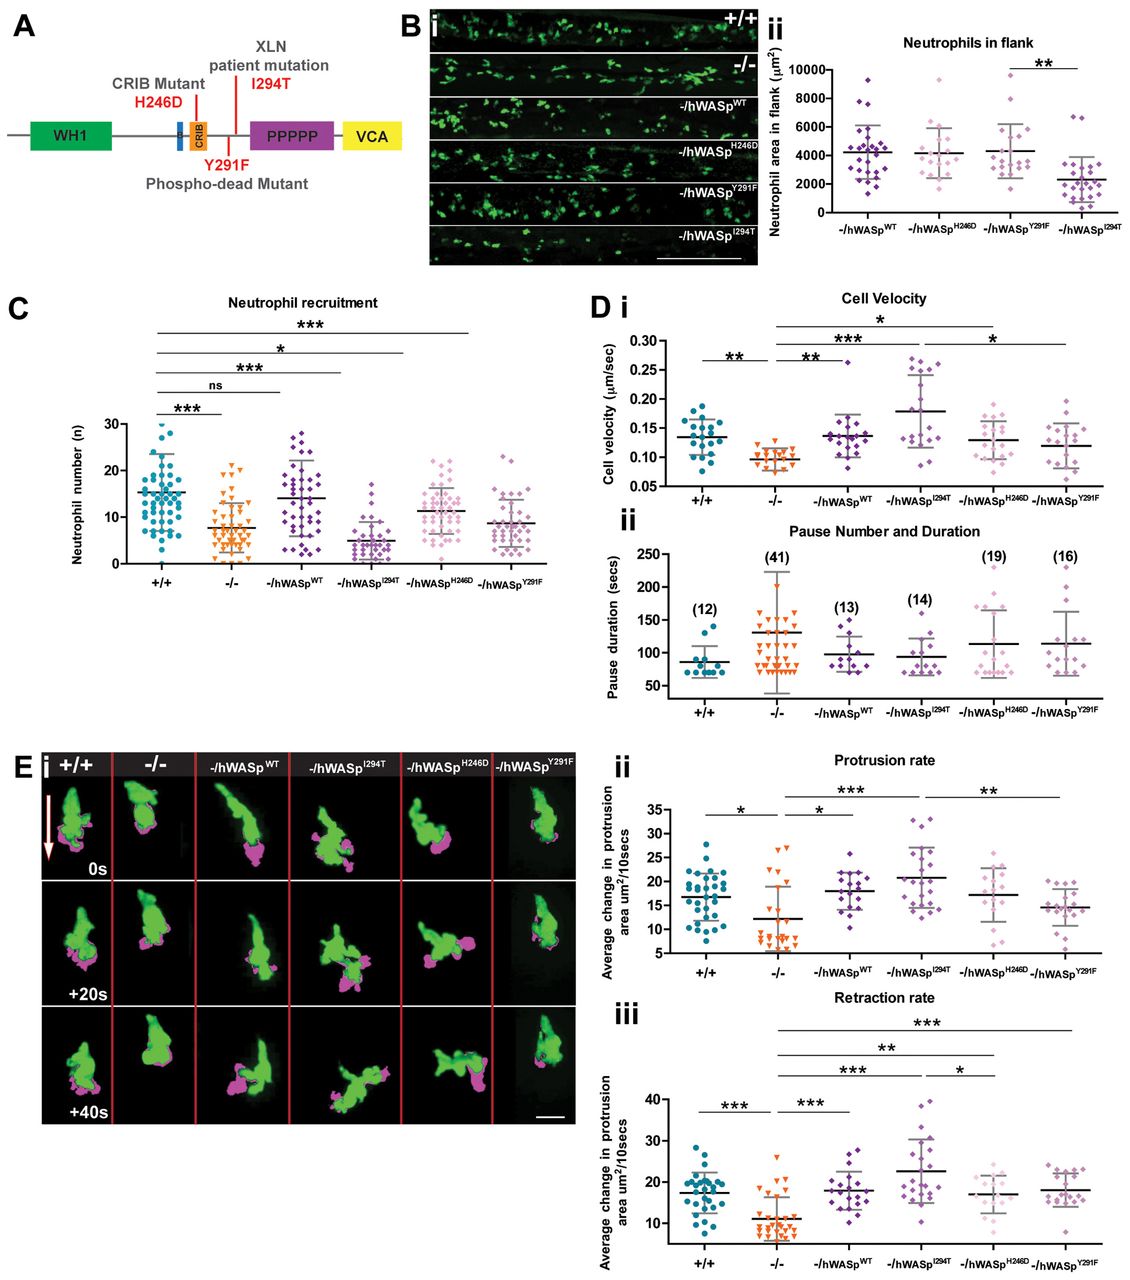
The Zebrafish WASp mutant can be rescued to varying degrees by introduction of WT hWASp and clinical WASp mutants. (A) Schematic of hWASp indicating the various mutant constructs for attempted rescue of the zebrafish mutant phenotype. (B) (i) lyz:Gal4-VP16 UAS:Kaede to reveal neutrophils (green), shows evidence of neutropenia only in the flanks of -/hWASpI294T ‘rescued larvae’ with (ii) quantification of neutrophil deficiency by measurement of total neutrophil area in the hematopoietic region. (C) Degree of ‘rescue’ of neutrophil recruitment at 2hours post wounding, after expression of hWASp constructs in the mutant background. (D) Tracking analysis of neutrophils following expression of each of the hWASp mutant constructs: (i) Quantification of the velocity of migrating cells (µm/sec), and (ii) pause duration (seconds), and pause number (in brackets). (E) Example still images from confocal time-lapse movies to illustrate protrusion analysis (magenta) applied to migrating hWASp mutant ‘rescues’ (see supplementary material Movie 1). Direction of the wound indicated by white arrow. (F) Quantification of rate of protrusion (i) and retraction (ii) in migrating hWASp mutant ‘rescues’. Error bars (s.d); asterisks denote significance values of *P<0.05, **P<0.01 and ***P<0.001 by one-way ANOVA. Scale bars: 100μm (B); 10μm (E).