
Fig. 2
- ID
- ZDB-IMAGE-131108-29
- Publication
- Anchelin et al., 2013 - Premature aging in telomerase-deficient zebrafish
- All Figures
- Figures for Anchelin et al., 2013
|
Fig. 2
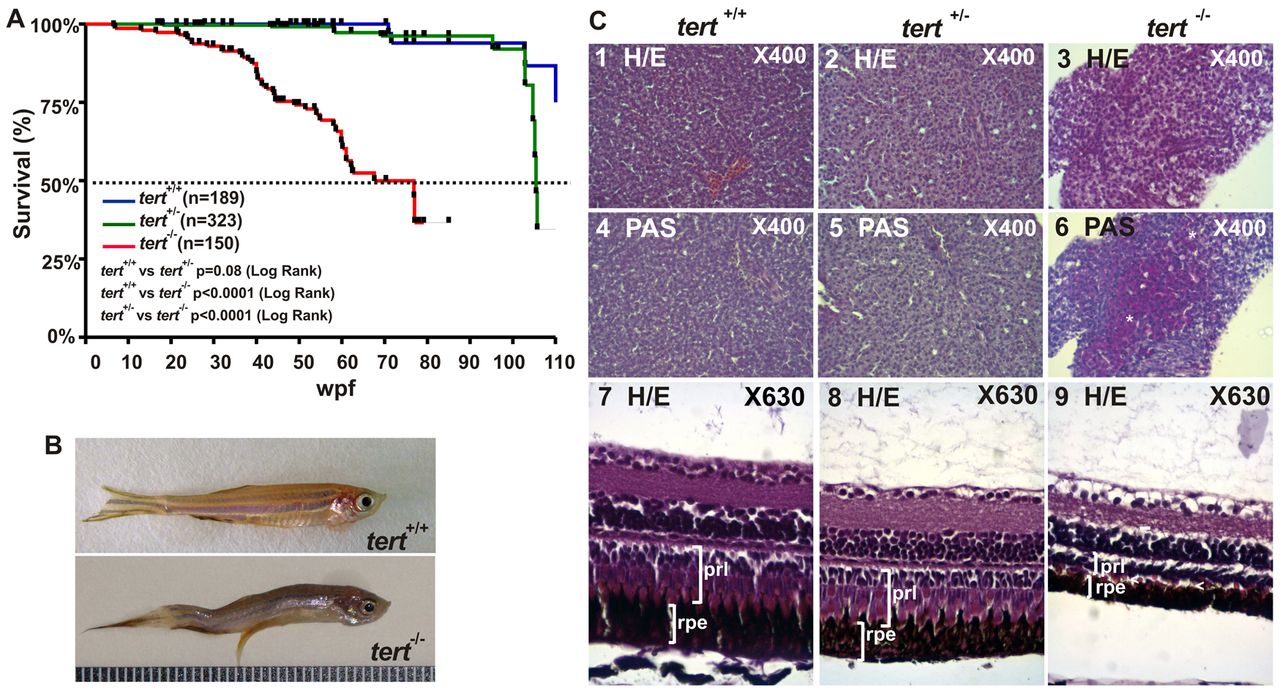
Premature aging signals in tert mutant zebrafish. (A) Kaplan-Meier representation of the survival of three genetic backgrounds. Post-hatching time is shown in weeks. A dashed line indicates 50% survival. The Log Rank test was used for statistical analysis. (B) Representative image of a tert+/+ and a tert-/- zebrafish at 11 months old. (C) Liver sections stained with H&E showed cytoplasmic vacuolization of hepatocytes (3) and were PAS-positive (6, white asterisks). H&E-stained eye sections revealed a decreased thickness of both retinal pigmented epithelium (rpe) and the photoreceptor layer (prl), which had a disorganized appearance (9, white arrowheads). Representative images are from at least three fish per genotype.