
Fig. S1
- ID
- ZDB-IMAGE-131105-11
- Publication
- Satou et al., 2013 - Transgenic tools to characterize neuronal properties of discrete populations of zebrafish neurons
- All Figures
- Figures for Satou et al., 2013
|
Fig. S1
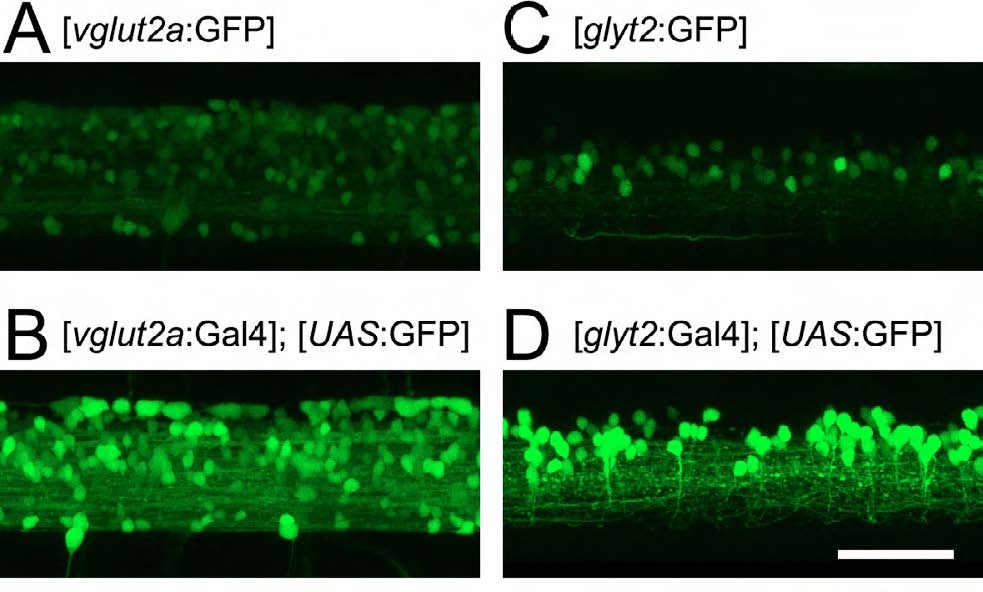
High levels of GFP expression driven by Tg[vglut2a:Gal4] and Tg[glyt2:Gal4]. Comparisons of GFP expression between the simple transgenic fish (Tg[vglut2a:GFP] and Tg[glyt2:GFP]) and the corresponding Gal4 transgenic fish. Images were taken from fish that were 3.5 dpf. (A,B) Lateral views of the spinal cord in the Tg[vglut2a:GFP] transgenic fish and the Tg[vglut2a:Gal4]; Tg[UAS:GFP] compound transgenic fish. Higher levels of GFP expression occurs in B. (C,D) Lateral views of the spinal cord in the Tg[glyt2:GFP] transgenic fish and the Tg[glyt2:Gal4]; Tg[UAS:GFP] compound transgenic fish. Higher levels of GFP expression occurs in D. Scale bar: 50 μm.