
Fig. 4
- ID
- ZDB-IMAGE-131015-48
- Antibodies
- Publication
- Wei et al., 2013 - miR-153 Regulates SNAP-25, Synaptic Transmission, and Neuronal Development
- All Figures
- Figures for Wei et al., 2013
|
Fig. 4
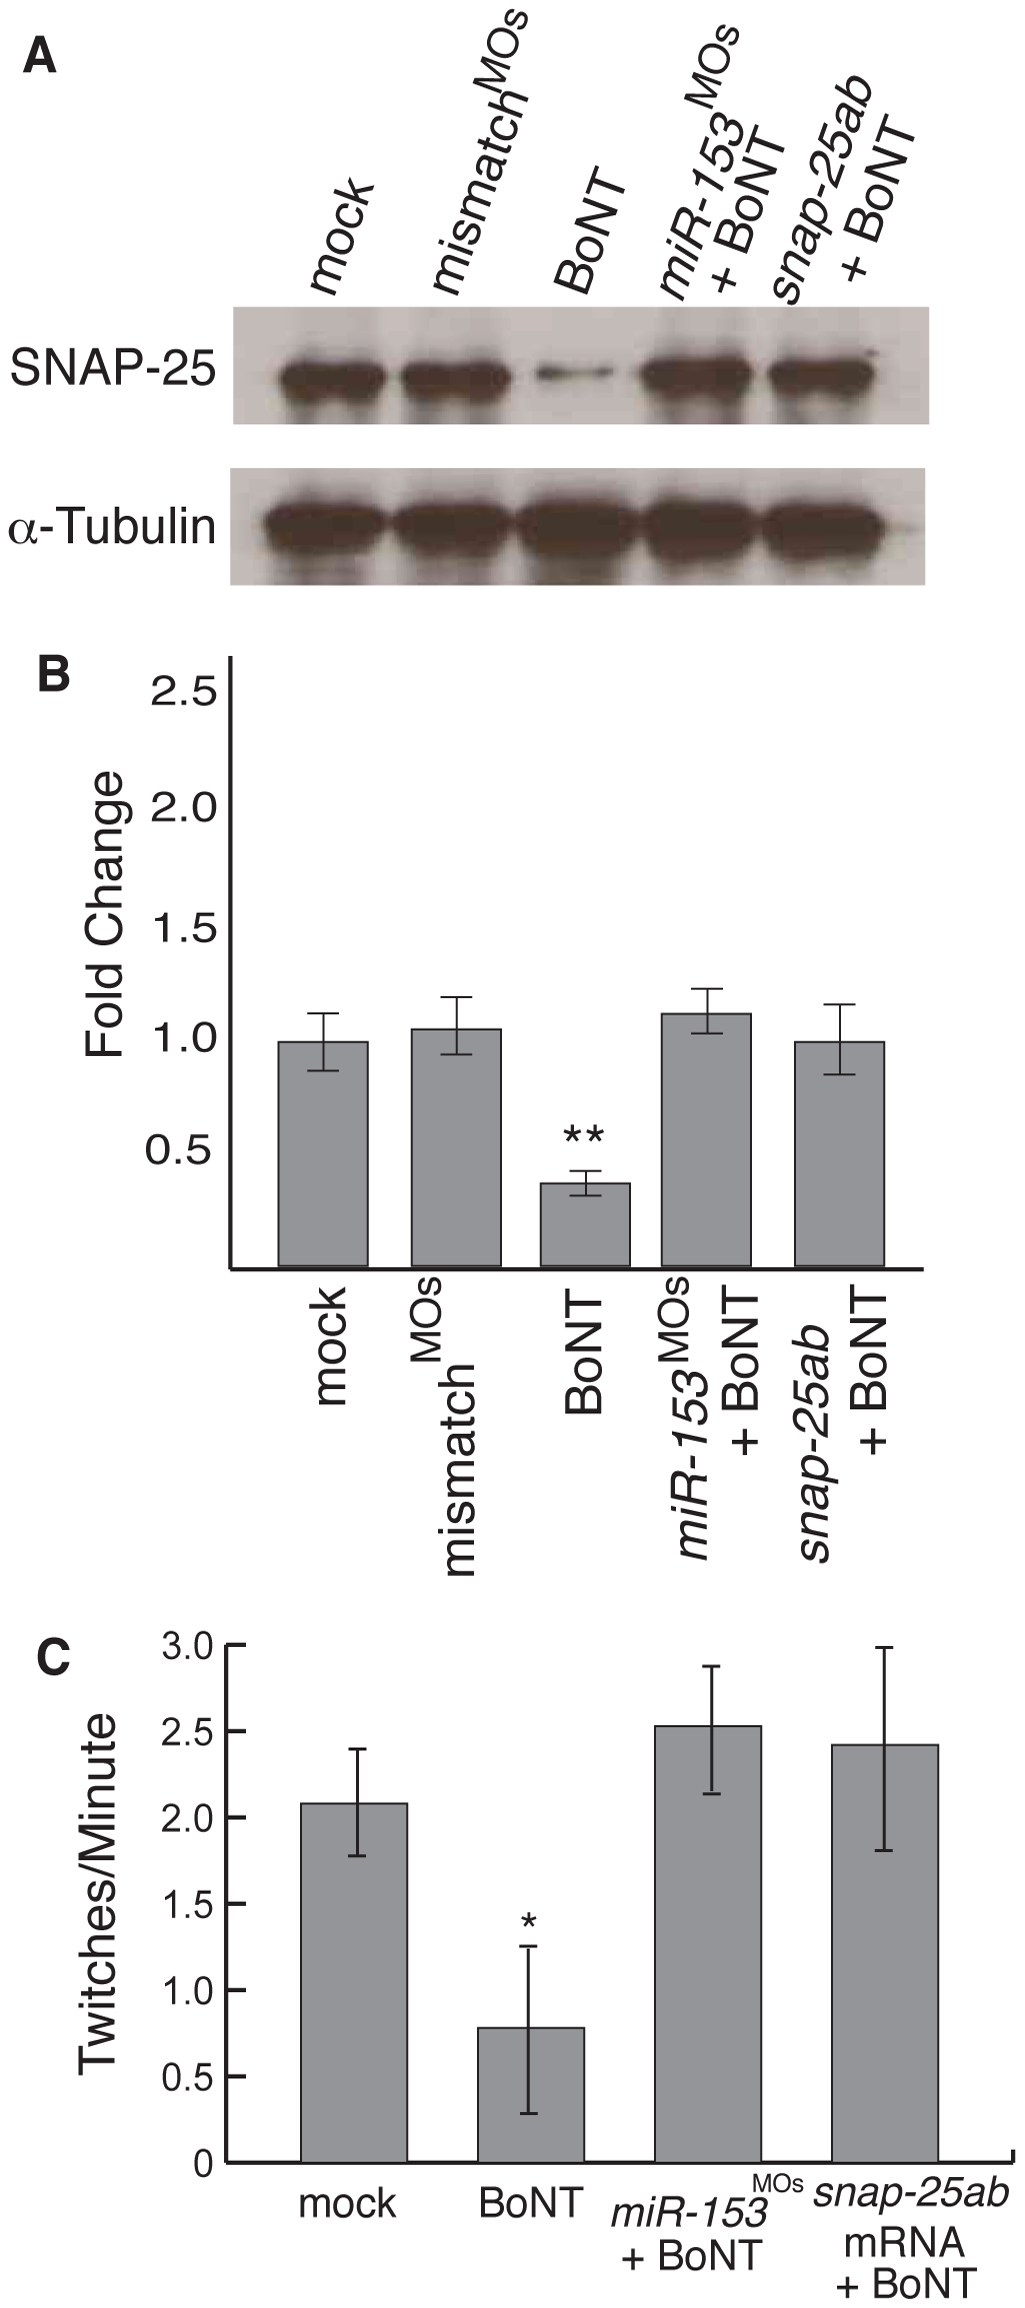
miR-153 mimics the effects of BoNT A.
(A) Single cell embryos were injected as indicated and then at 27 hpf, exposed to Botulinum neurotoxin A (BoNT) for 30 minutes. After recovery for 1 hour, western blots were performed on embryo lysates using antibodies against SNAP-25 or α–tubulin. (B) Quantitation of SNAP-25 levels from A, n = 3. **, p<0.01 (C) Embryonic movement in the presence or absence of BoNT A. The number of twitches per minute was counted as in Fig. 1 for embryos treated as indicated. Significance was determined by comparing mock embryos to all other conditions using ANOVA with Dunnett’s post-test, n = 15. *, p<0.05.