
IMAGE
Fig. 3
- ID
- ZDB-IMAGE-131009-12
- Genes
- Antibodies
- Publication
- Chang et al., 2013 - Compensatory regulation of Na+ absorption by Na+/H+ exchanger and Na+-Cl- cotransporter in zebrafish (Danio rerio)
- All Figures
- Figures for Chang et al., 2013
Image
|
Figure Caption
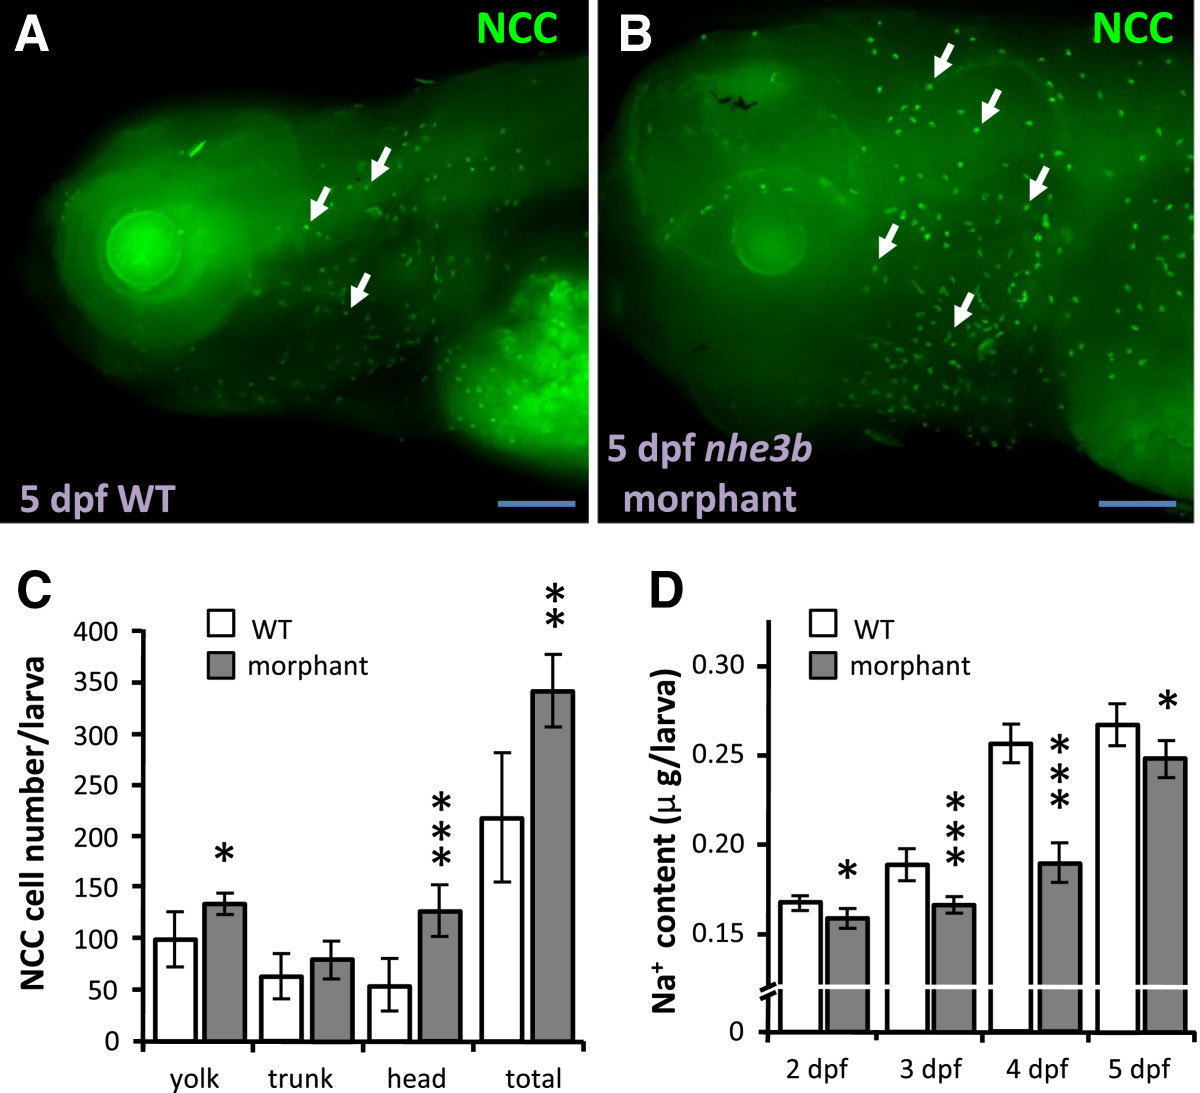
Fig. 3
Knockdown of nhe3b increases NCC cell number. (A, B): NCC (arrow) immunostaining images of 5-dpf wild type larvae (WT) and nhe3b morphants. Scale bar = 100 μm. (C): Comparison of NCC cell number in different areas between 5-dpf wild type larvae (white bars) and nhe3b morphants (gray bars) (n = 8). (D): Whole body Na+ content in wild type larvae (white bars) and nhe3b morphants (gray bars) at different developmental stages (n = 6). Mean ± SD. *p < 0.05; **p < 0.01; ***p < 0.001 (Student’s t-test).
Figure Data
Acknowledgments
This image is the copyrighted work of the attributed author or publisher, and
ZFIN has permission only to display this image to its users.
Additional permissions should be obtained from the applicable author or publisher of the image.
Full text @ Front. Zool.