
|
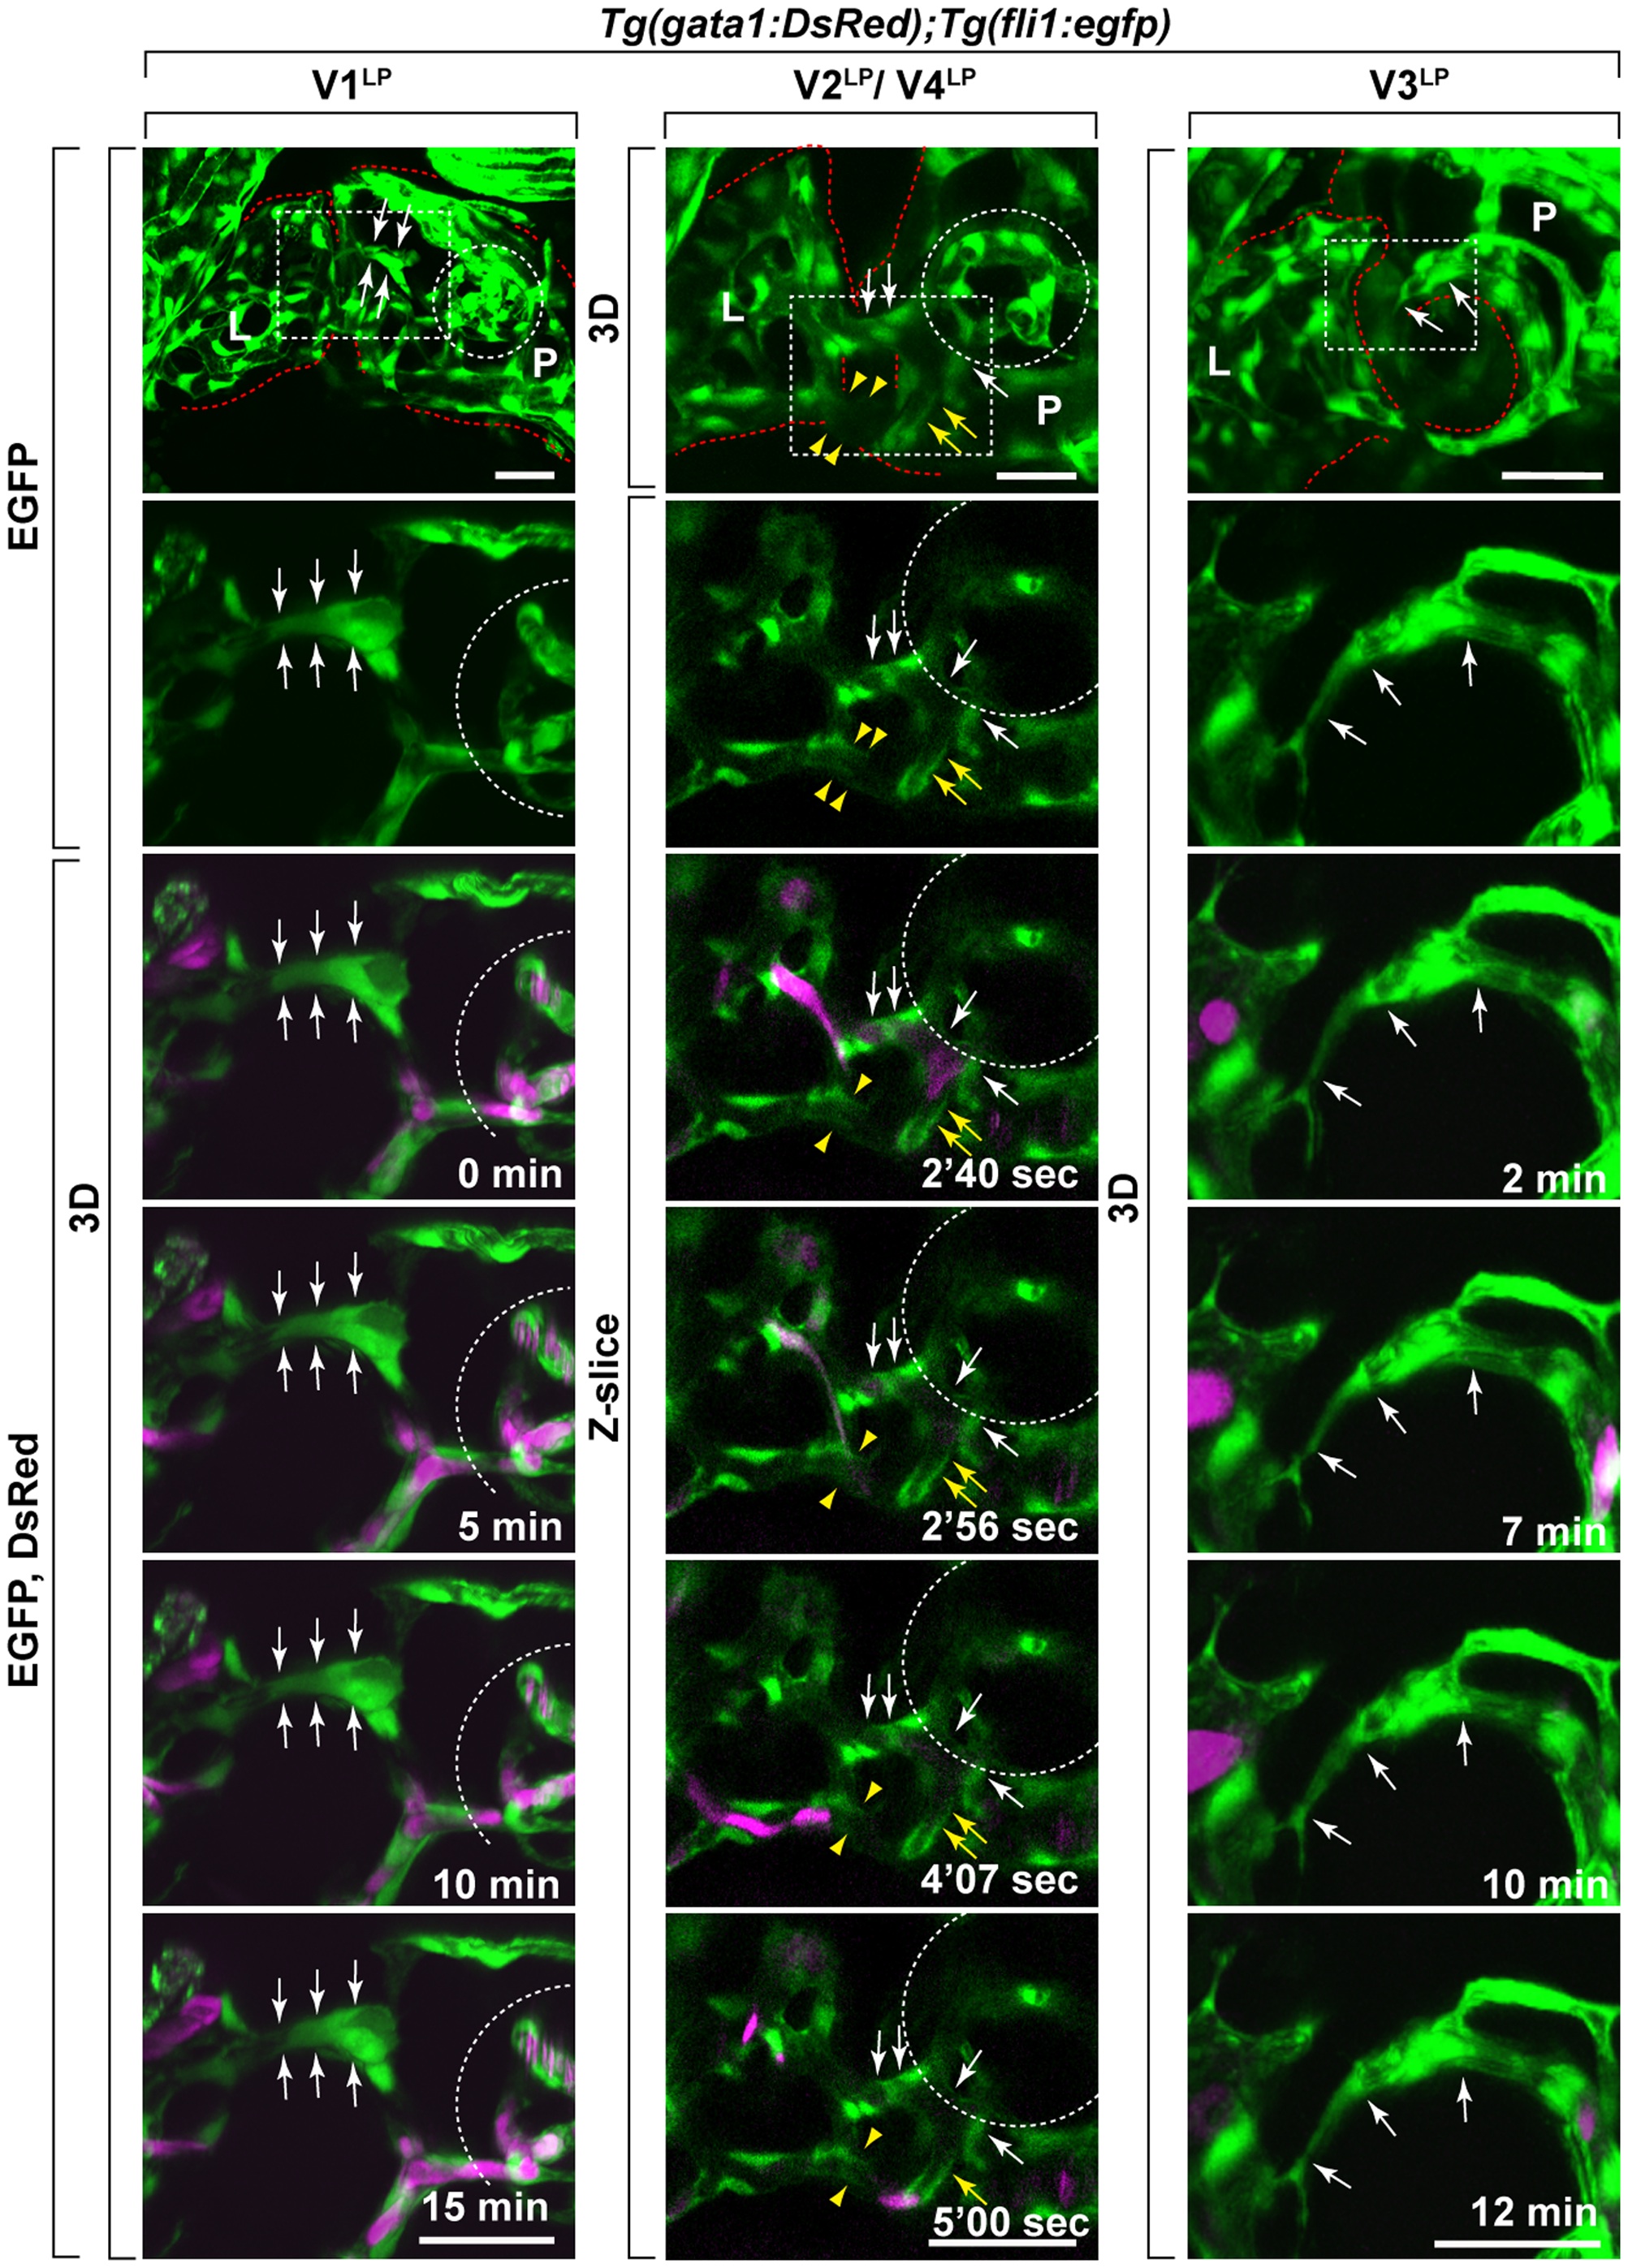
Fig. 4
Identification of the circulation of gata1+ blood cells through V2LP and V4LP inter-organ vessels.
Time-lapse two-photon microscopy images of Tg(gata1:DsRed);Tg(fli1:egfp) larvae at 5 dpf (V1LP, V2LP, V4LP) and at 6 dpf (V3LP). No circulation of gata1+ blood cells was observed within V1LP or V3LP vessels during the 15 min. or 14 min. imaging periods, respectively. In contrast, the circulation of gata1+ blood cells was clearly observed both within V2LP and V4LP vessels during the 7 min. imaging period. The 3D rendered (3D) and/or Z-slices are shown. EGFP (green): fli1+ vessels; DsRed (magenta): gata1+ blood cells. The time-stamp (min: minute, sec: second) is indicated at the bottom right in each bottom panel. Scale bars: 30 μm.