
Fig. 4
- ID
- ZDB-IMAGE-130907-29
- Publication
- McCarthy et al., 2013 - Pdgfra protects against ethanol-induced craniofacial defects in a zebrafish model of FASD
- All Figures
- Figures for McCarthy et al., 2013
|
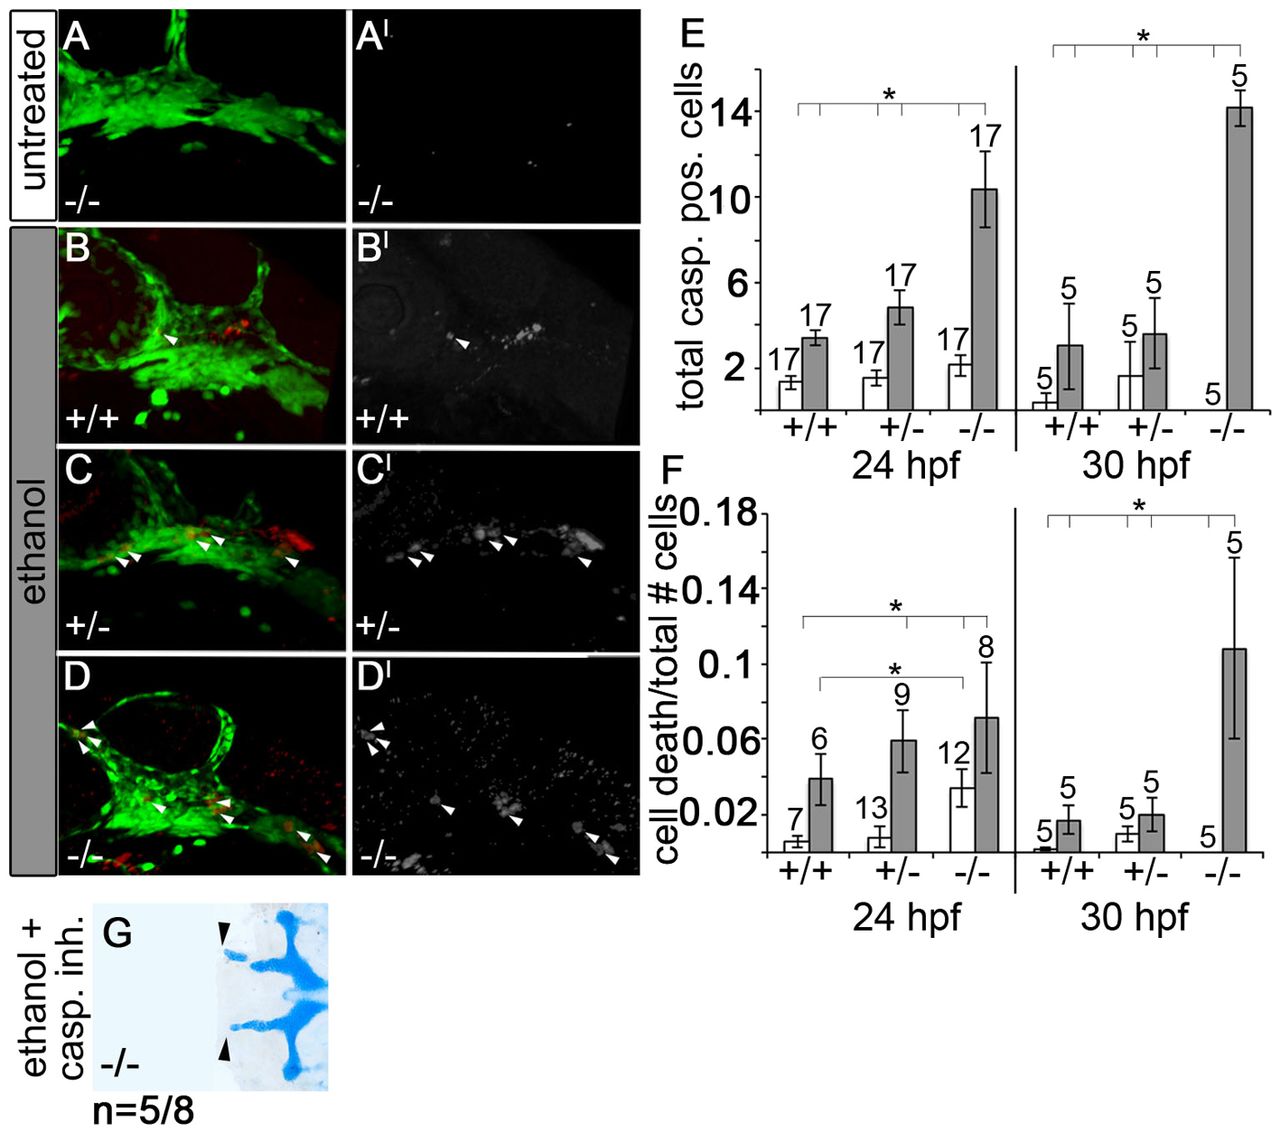
Fig. 4
Ethanol-treated pdgfra mutants exhibit an increase in neural crest cell death. (A-D) Confocal images of 24 hpf anti-active caspase 3-stained fli1;EGFP embryos. (A2-D2) Active-caspase 3 staining alone. Anterior is towards the left. (A-C2) Untreated pdgfra mutants, ethanol-treated wild types and ethanol-treated heterozygotes have low levels of neural crest apoptosis. (D,D2) Ethanol-treated pdgfra mutants have greatly elevated levels of neural crest apoptosis. Arrowheads indicate apoptotic neural crest cells. (E) Quantification of cell death across genotypes at 24 hpf and 30 hpf, after ethanol was removed at 24 hpf (untreated control, light bars; ethanol, dark bars). Ethanol-treated pdgfra mutants show significant elevation in cell death compared with all other genotypes (one-way ANOVA, *Pd0.05). (F) Quantification of the ratio of cell death relative to total crest cells (untreated control, light bars; ethanol, dark bars; black bars above cell death ratio indicate significant differences using one-way ANOVA, *Pd0.05). (G) 5 dpf pdgfra mutant treated with 1.0% ethanol and 25 μM caspase inhibitor at 10-24 hpf. Arrowheads indicate partial rescue of the trabeculae (compare G with Fig. 1C,F). Group numbers are indicated above the bars in each graph.