
Fig. S4
- ID
- ZDB-IMAGE-130830-8
- Publication
- Ninov et al., 2013 - Metabolic Regulation of Cellular Plasticity in the Pancreas
- All Figures
- Figures for Ninov et al., 2013
|
Fig. S4
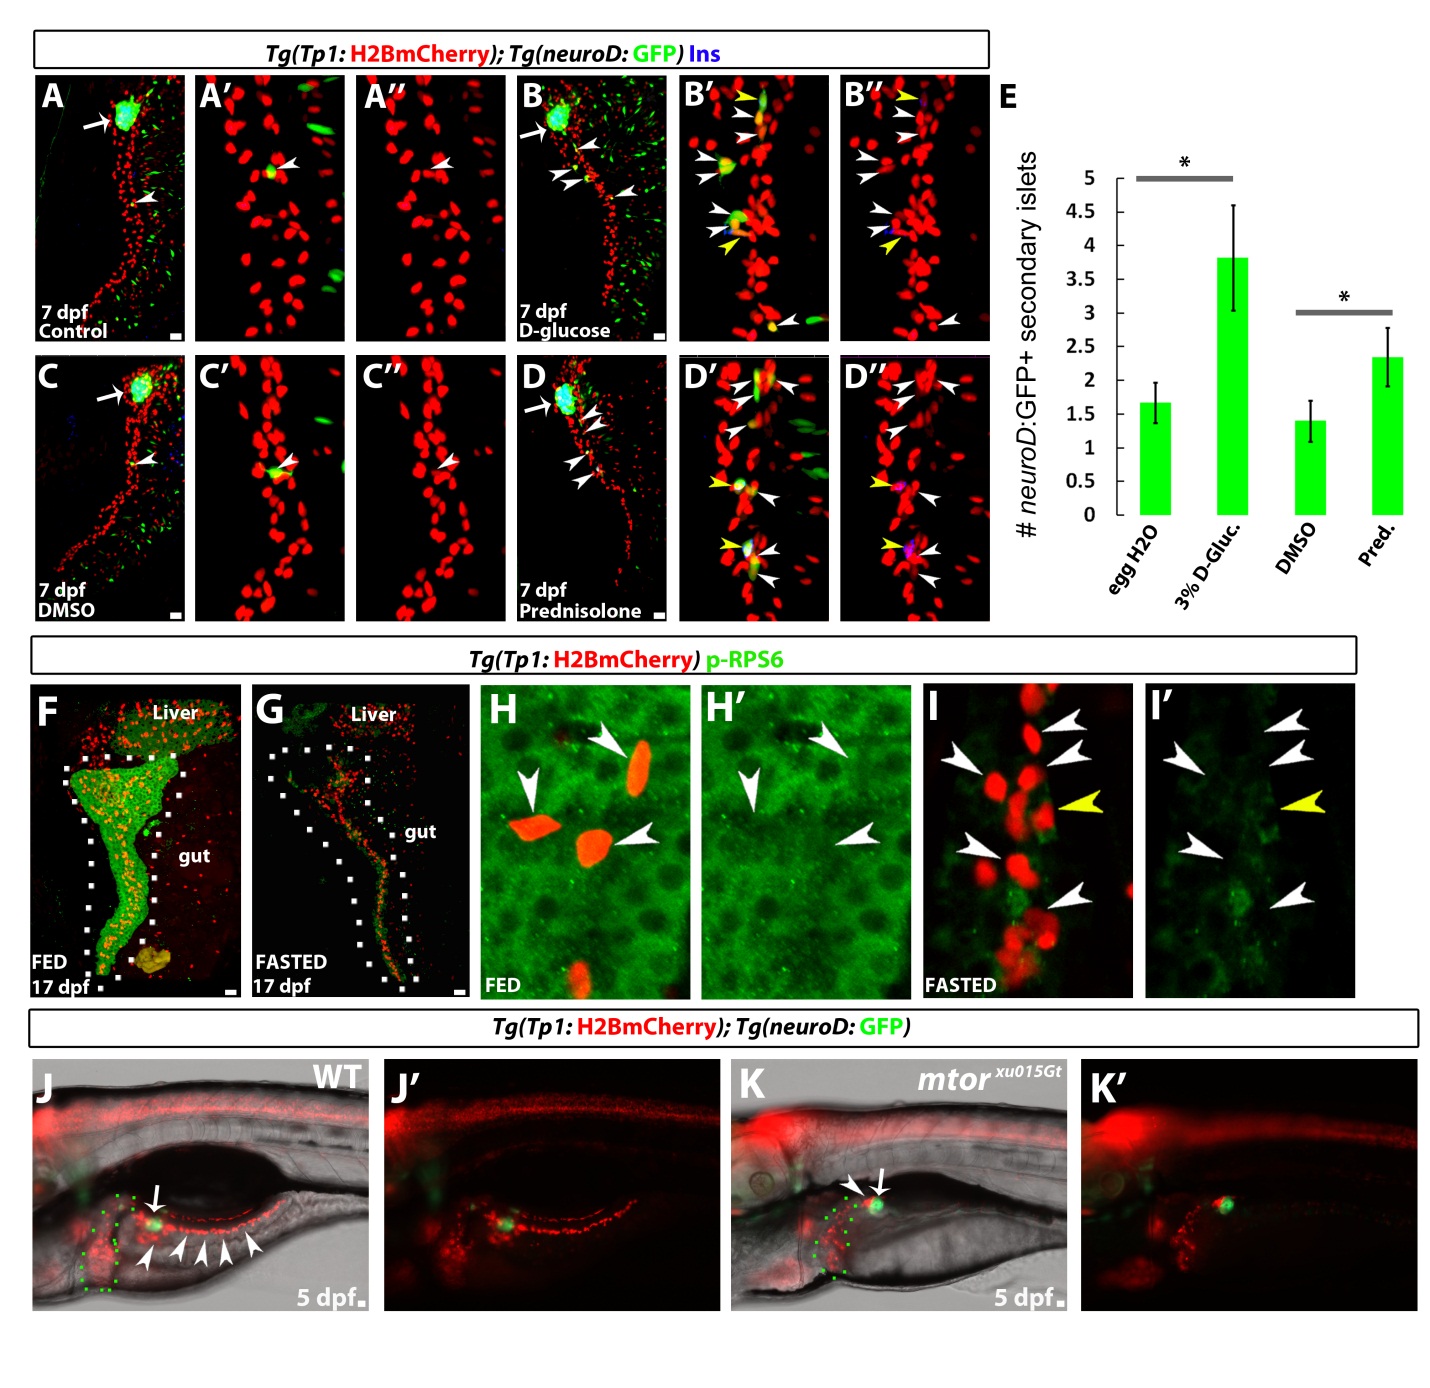
High Glucose Increases Endocrine Differentiation; TOR Is Required for the Expansion of the Progenitor Pool in the IPD, Related to Figure 4
(A–D) Tg(TP1:H2BmCherry);Tg(neuroD:GFP) animals were incubated in egg water (A), 3% D -glucose solution (B), DMSO (C) or 10 μM Prednisolone (Glucocorticoid) (D) from 3.5 to 7dpf. Whereas each control animal (A, C) exhibits only one Tg(neuroD:GFP)+ SI (arrowheads), the glucose- and prednisolone-treated animals have formed several SIs (arrowheads). The high magnification projections with separate channels show that all ectopic Tg(neuroD:GFP)+ cells are also Tg(TP1:H2BmCherry)+ and thus have recently 10 differentiated from NRCs. Yellow arrowheads point to Tg(neuroD:GFP)+ cells that also exhibit Insulin immunoreactivity.
(E) Quantification of the average number of Tg(neuroD:GFP)+ SIs for animals incubated in egg water (n = 22 animals), 3% D-Glucose (n = 18 animals), DMSO (n = 20 animals) or 10 μM Prednisolone (n=20 animals). Statistical significance was calculated using an unpaired one-tailed t-test. (*p < 0.05).
(F and G) Tg(TP1:H2BmCherry) animals were fed regularly until 17dpf (F) or fasted from 15 to 17dpf (G) and then stained with an antibody against phosphorylated RPS6 (p-RPS6) (green). p-RPS6 levels appeared to be reduced in the pancreata of fasted animals compared to fed ones. Note that in the fed animals, the pancreas (outlined by a white dashed line) appears to exhibits higher levels of p-RPS6 immunoreactivity compared to liver and gut.
(H and I) High magnification single planes showing p-RPS6 immunoreactivity in the NRCs (arrowheads) of fed animals (H) and a strong downregulation in the NRCs (arrowheads) after fasting (I). The yellow arrowhead in I points to a single NRC that exhibits low levels of p-RPS6 immunoreactivity.
(J and K) Epifluorescence images of WT (J) and mtorxu015Gt homozygous mutants (K). In WT, by 5dpf, the pancreatic NRCs have expanded in number and form the IPD (arrowheads). mtorxu015Gt homozygous mutant animals display a strong defect in NRC expansion resulting in a reduced pool of NRCs, as well as a failure of IPD branching by 5dpf (arrowhead). The PI (arrow) appears unaffected compared to WT. Note that there is very limited proliferation of β-cells during the embryonic stages [2]. In addition, the NRCs in the liver appear less severely affected (the liver is outlined by a green dashed line in F and G). A-I show lateral views, anterior to the top, dorsal to the left. J,K show anterior to the left, dorsal to the top. Error bars = s.e.m.. Scale bars, 20 μm.