
|
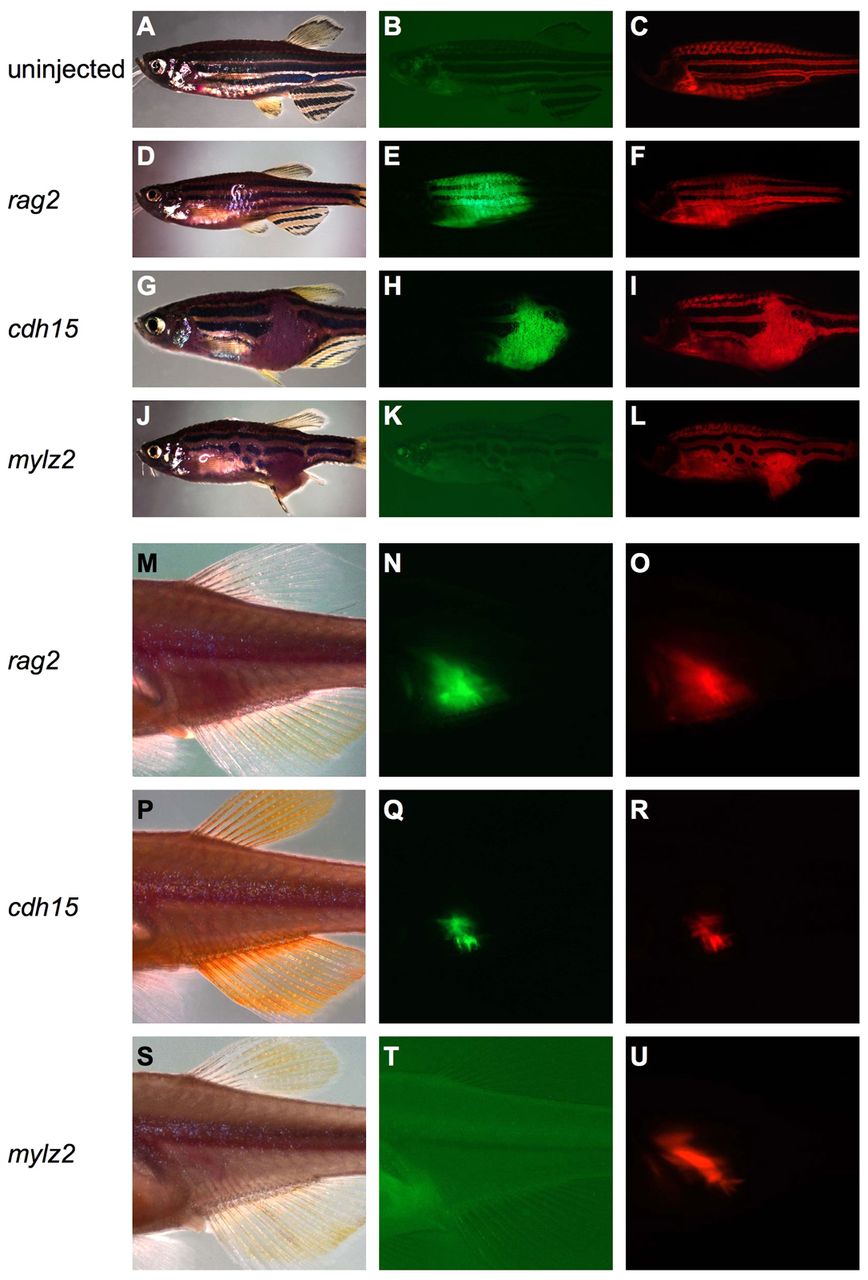
Fig. 6 Tumors in the myf5:GFP;mylz2:mCherry background differ in the degree of GFP fluorescence. (A-L) Brightfield (A,D,G,J), GFP (B,E,H,K) and mCherry (C,F,I,L) fluorescent images of uninjected fish (A-C) or tumor-bearing fish that had been injected with the rag2:KRASG12D (D-F), cdh15:KRASG12D (G-I) or mylz2:KRASG12D (J-L) transgenes at the one-cell stage. (M-U) Engrafted, secondary tumors in irradiated casper recipient fish display similar patterns of fluorescence to their respective primary, parent tumors. Brightfield (M,P,S), GFP fluorescence (N,Q,T), and mCherry fluorescence (O,R,U) images of casper fish transplanted with G+R- cells from a rag2 tumor (M-O), cdh15 tumor (P-R) or mylz2 tumor (S-U).