
Fig. 4
- ID
- ZDB-IMAGE-130815-2
- Publication
- Qian et al., 2013 - The DMAP interaction domain of UDP-GlcNAc:lysosomal enzyme N-acetylglucosamine-1-phosphotransferase is a substrate recognition module
- All Figures
- Figures for Qian et al., 2013
|
Fig. 4
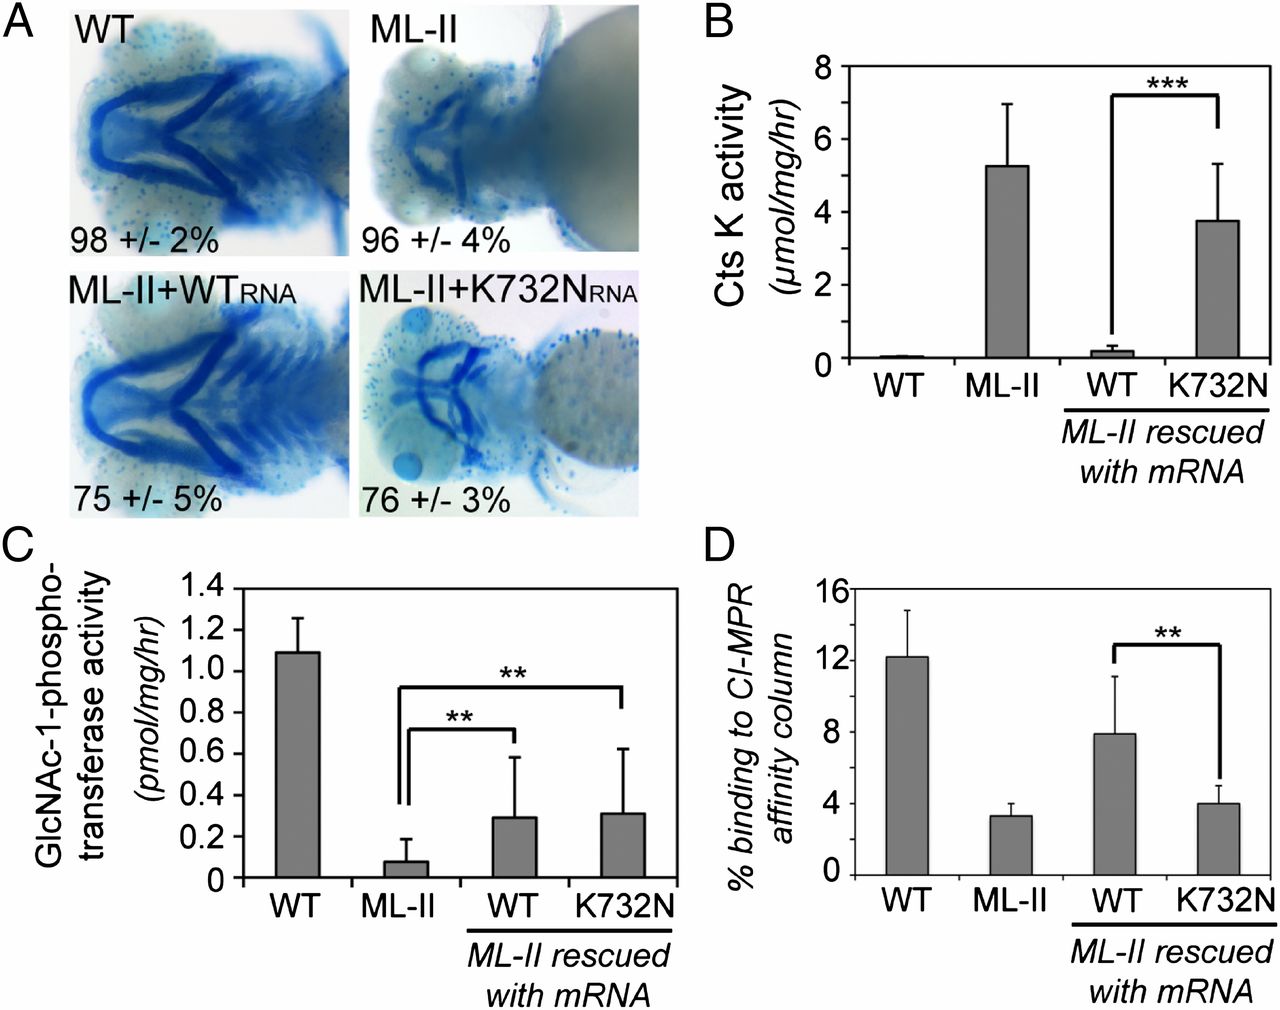
The K732N mutant fails to rescue MLII zebrafish. (A) Embryos were stained at 4 dpf with Alcian blue to reveal cartilage; representative images are shown. The percentage of embryos with a staining pattern consistent with the images shown is presented. Results represent an average of 5 individual experiments, with 30–40 embryos scored per experiment. (B) Cathepsin K activity was measured in embryo lysates, using a fluorogenic peptide substrate. Average activity from 8 to 9 independent experiments is shown. Error bars represent SD for all of the graphs. ***P < 0.01. (C) GlcNAc-1-phosphotransferase activity toward αMM was determined in embryo lysates, using the UDP-[3H]GlcNAc substrate. Results represent the average of 3 independent runs. **P < 0.05. (D) Bars represent the percentage of β-galactosidase activity that is Man-6-P modified in embryo lysates that were fractionated using a CI-MPR affinity column. Averages from 4–5 individual experiments are shown. **P < 0.05.