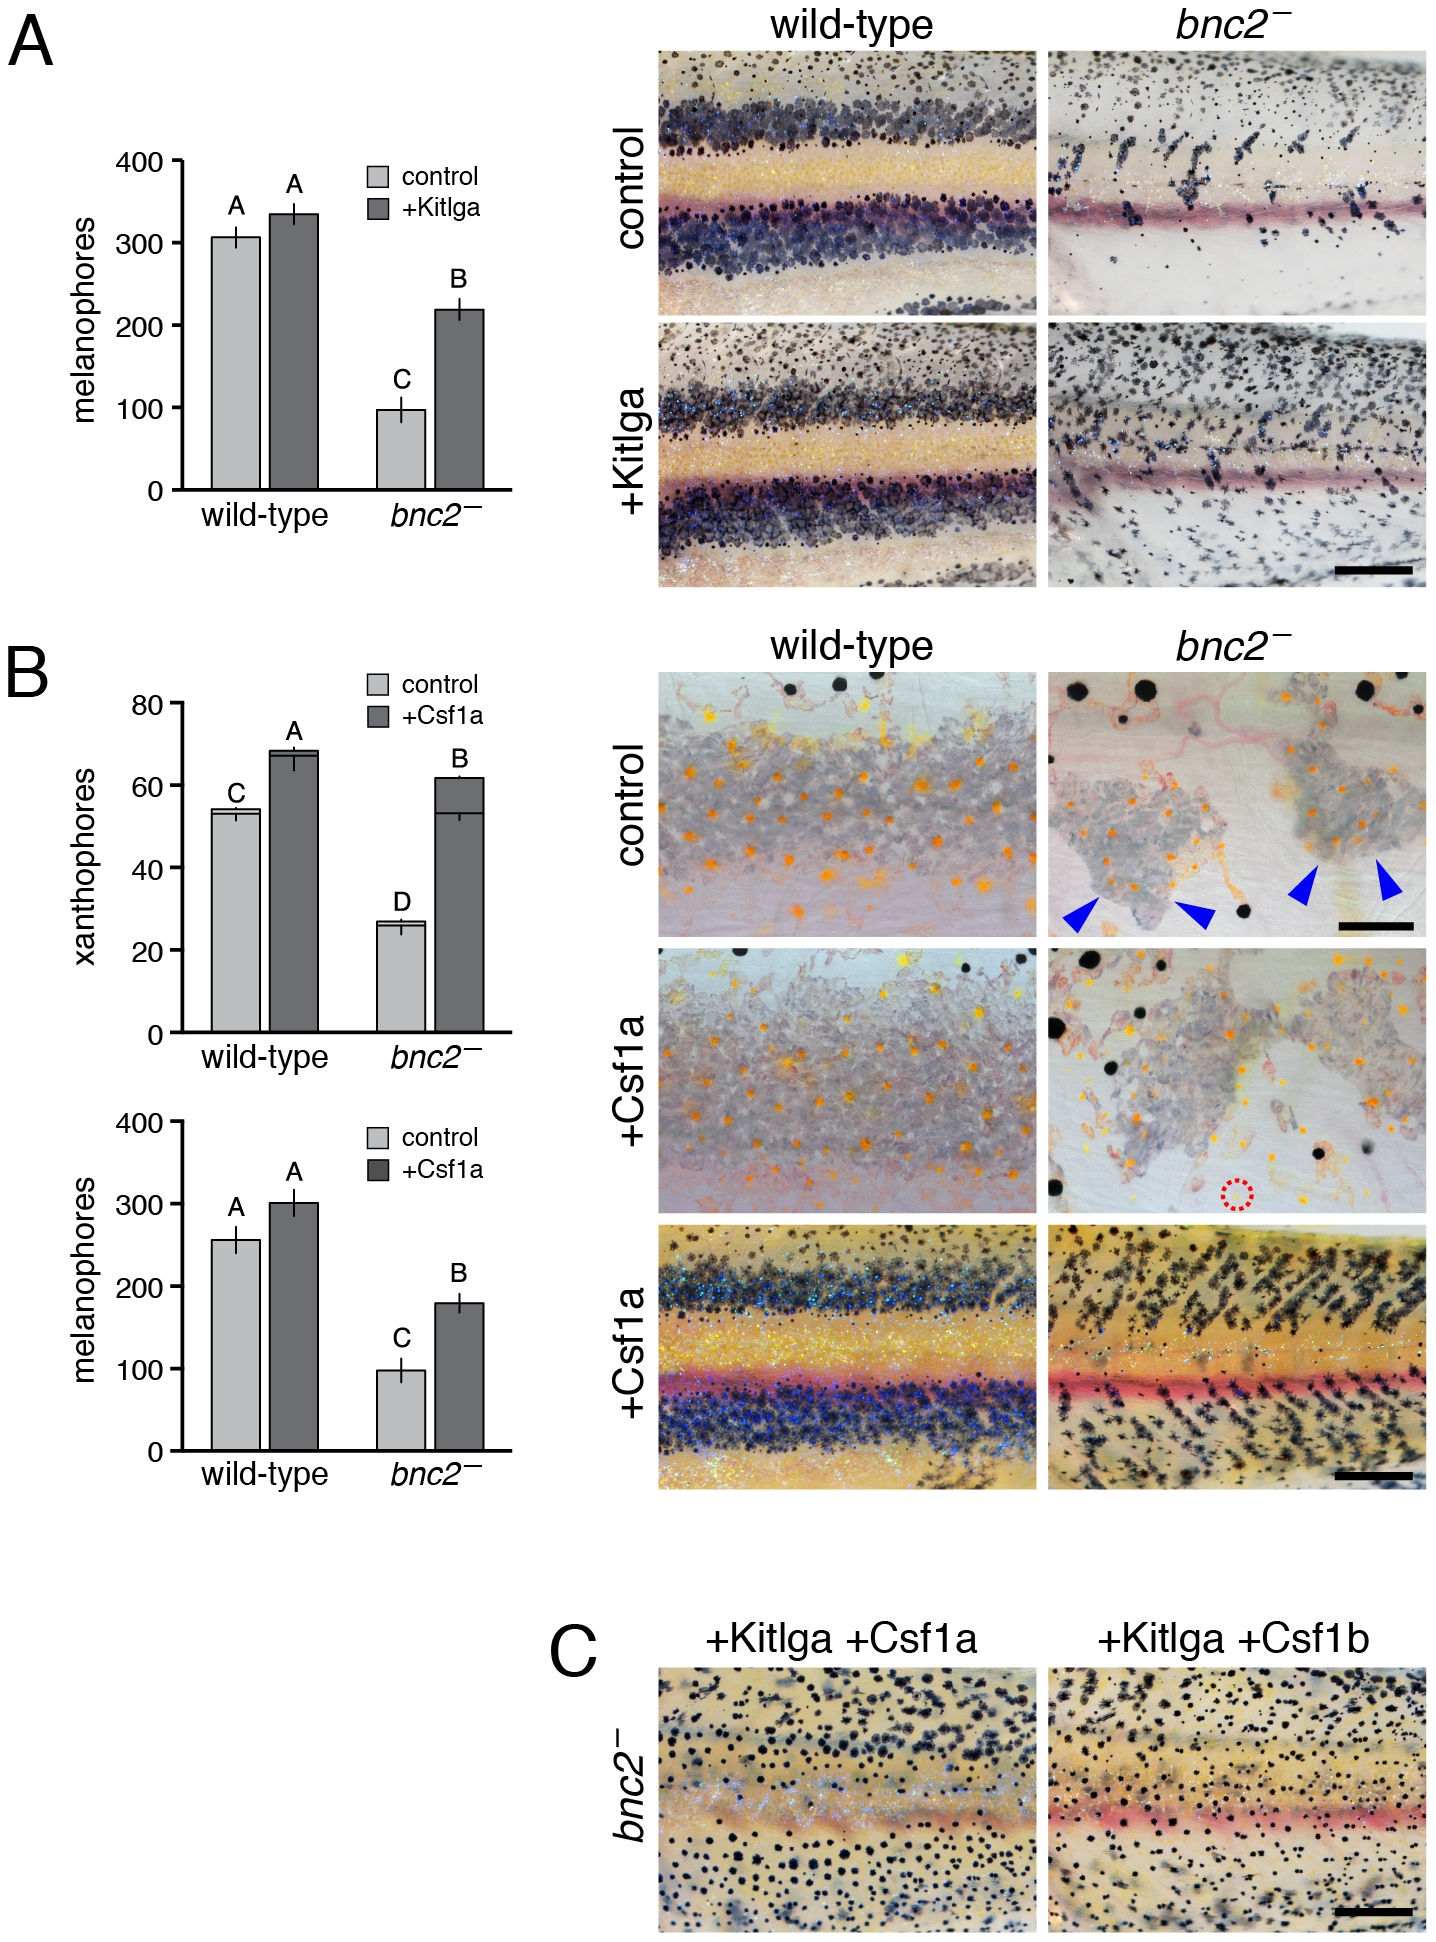
Fig. 2
Re-expression of Kitlga, Csf1a, and Csf1b in bnc2 mutants promoted melanophore and xanthophore development but was insufficient for stripe patterning.
(A) Melanophore recovery following heat-shock induction of Tg(hsp70l:kitlga). Although Kitlga expression increased melanophore numbers in bnc2 mutant larvae, the restored melanophores failed to develop into stripes. Plots show means±SE with different letters above bars denoting means that differed significantly from one another in Tukey Kramer post hoc comparisons. All wild-type larvae are bnc2/+ siblings to bnc2 mutants. Sample sizes: bnc2/+, n = 10; bnc2, n = 10, bnc2/+ hsp70l:kitlga, n = 14; bnc2 hsp70l:kitlga, n = 14. (B) Xanthophore and melanophore recovery following heat-shock induction of Tg(hsp70l:csf1a). Upper plot, xanthophores were classed as either associated with iridophores (larger, lower segment of each bar), or not associated with iridophores (smaller, upper segment of each bar): total xanthophore numbers, including xanthophores not associated with iridophores were increased in bnc2 mutants by Csf1a expression. Lower plot indicates that melanophore numbers were increased as well. Images show xanthophores (yellow–orange cells) over iridophores (patches of grey cells in this illumination, denoted by blue arrowheads in the bnc2 mutant). Red dashed circle in bnc2 mutant +Csf1 panel shows a xanthophore that has developed at a distance from iridophores. Lower magnification images (bottom) show typical patterns and the absence of organized stripes in the bnc2 mutant after Csf1 expression, despite increased numbers of melanophores and xanthophores (compare to controls in A). Sample sizes: bnc2/+, n = 15; bnc2, n = 19, bnc2/+ hsp70l:csf1a, n = 19; bnc2 hsp70l:csf1a, n = 22. Results for Tg(hsp70l:csf1b) were equivalent (not shown; total sample size, N = 17). (C) Xanthophore and melanophore numbers were restored by heat shock induction of Tg(hsp70l:kitlga-csf1a) and Tg(hsp70l:kitlga-csf1b) yet stripes failed to form (total sample sizes, N = 7, 12, respectively). Scale bars: in (A) 500 μm for (A); in (B, upper) 80 μm for (B upper for images); in (B, lower) 500 μm for (B bottom 2 images); in (C) 500 μm for (C).

