
Image
|
Figure Caption
Fig. 3
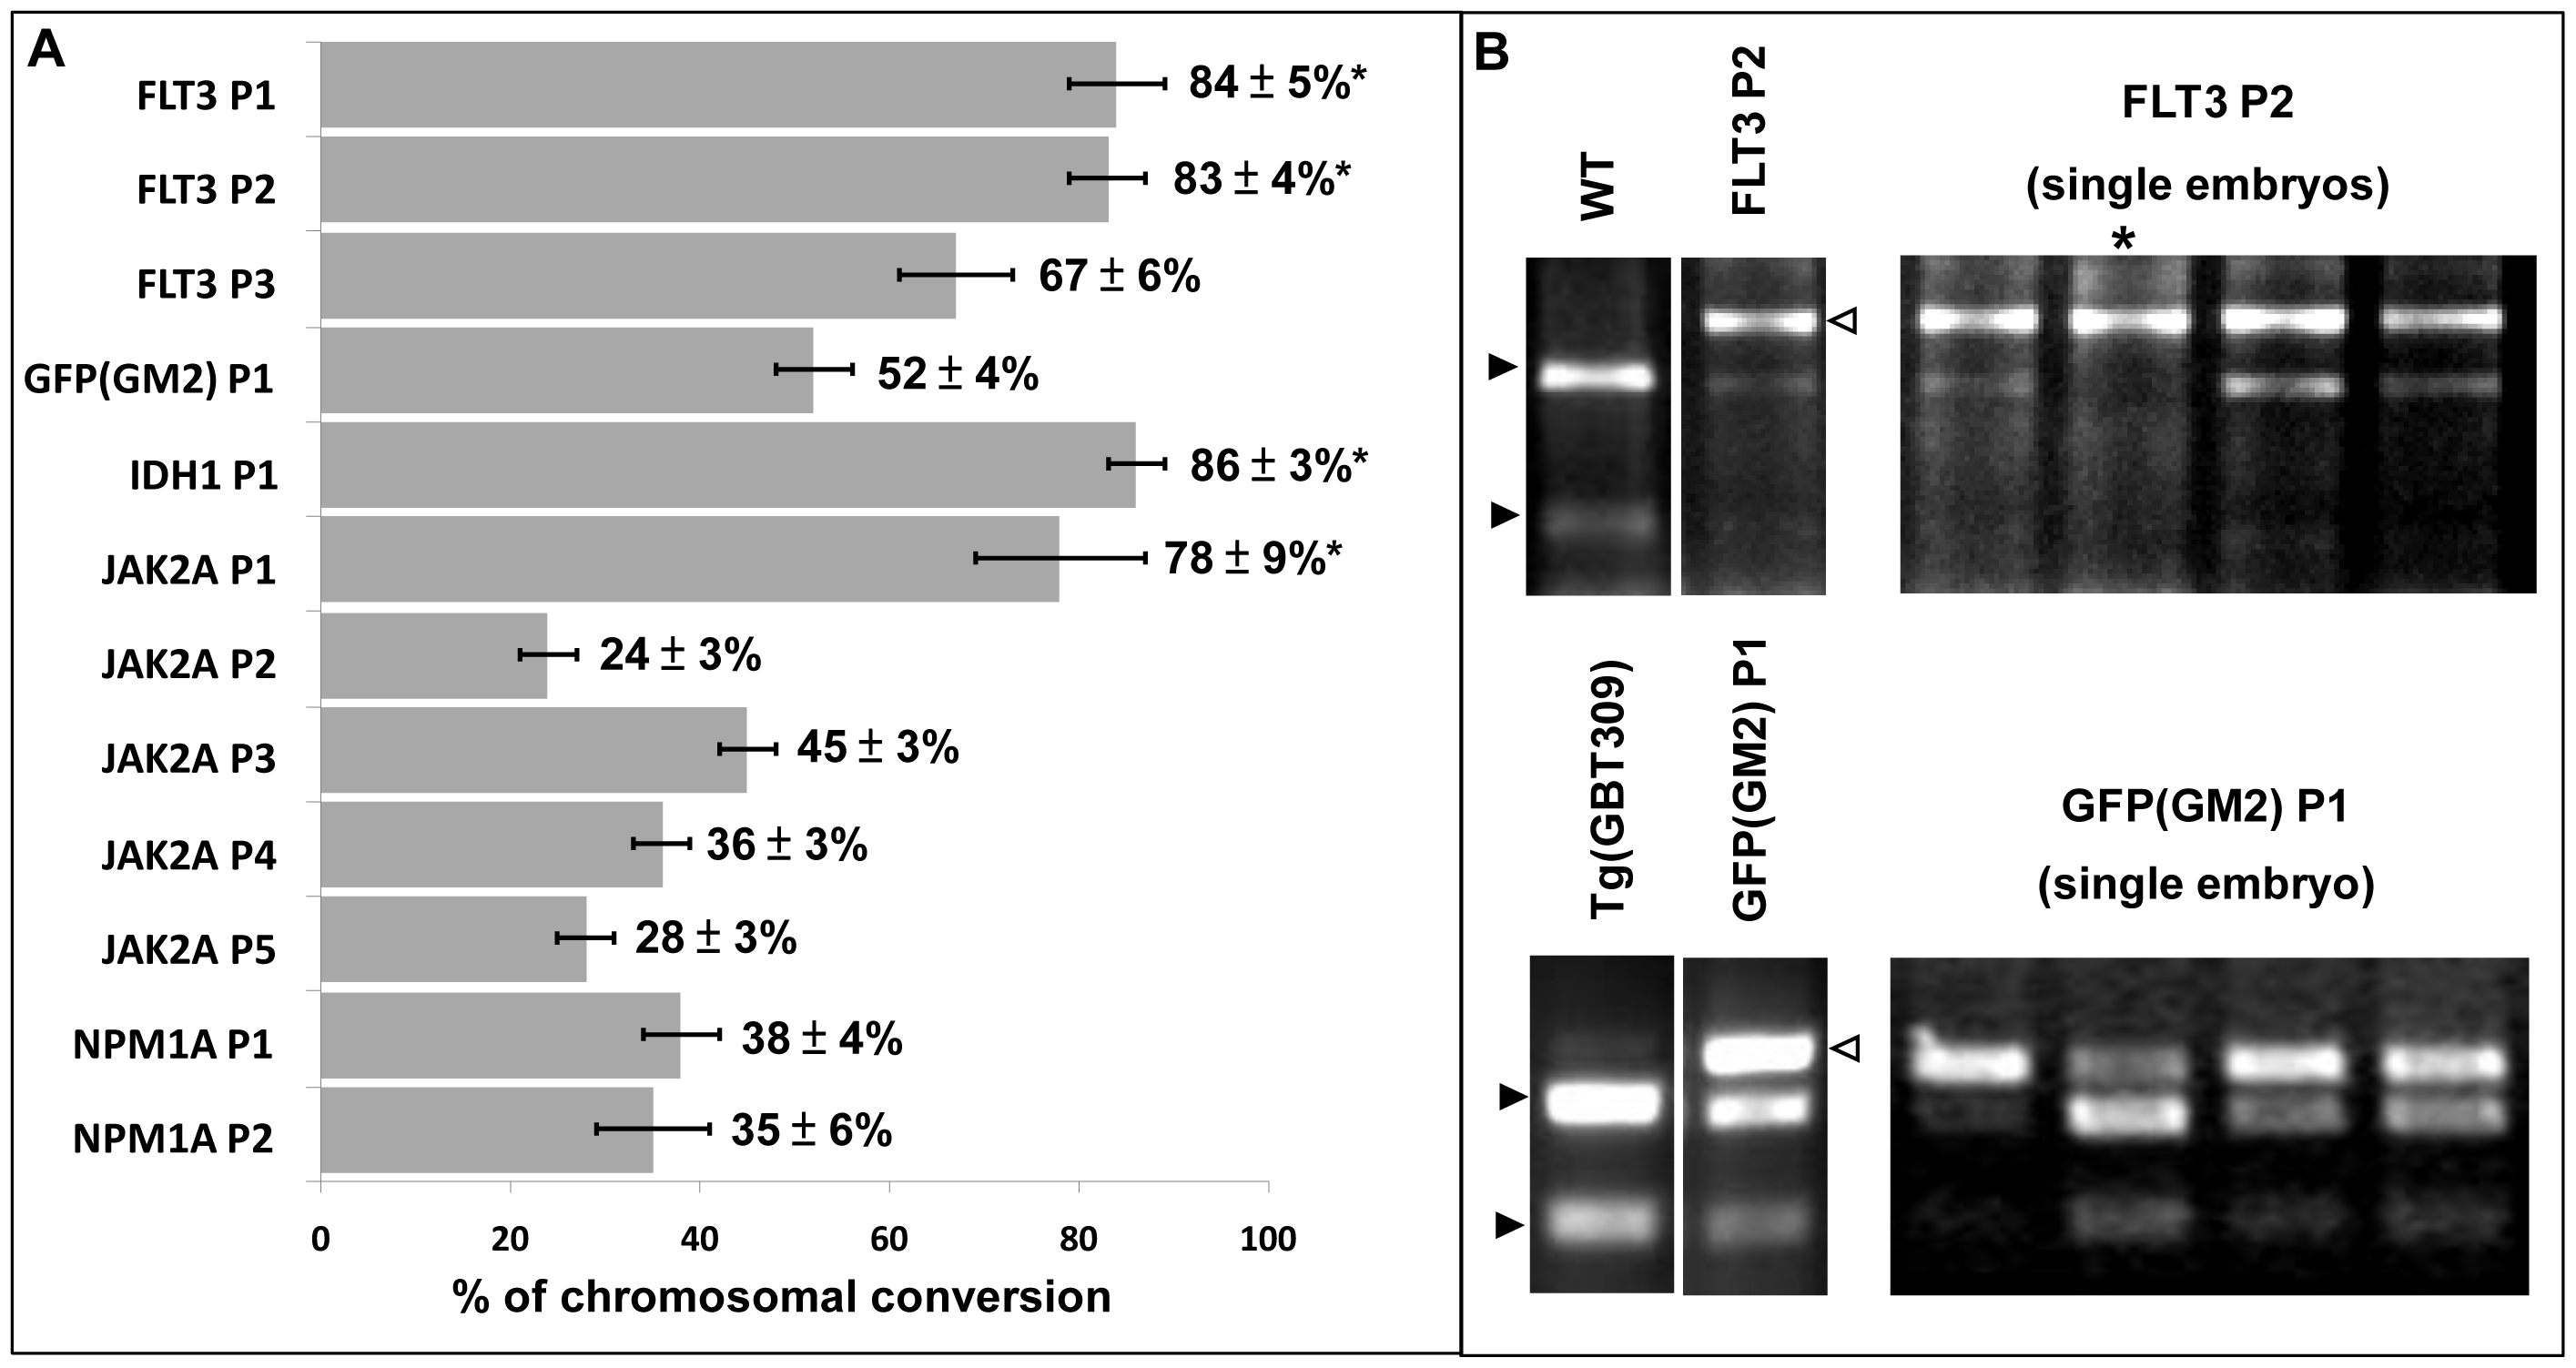
In vivo activity of 15-RVD GoldyTALENs.
(A) In vivo activity (% of chromosome conversion at somatic level) of 15-RVD TALEN pairs. Results shown were averages of 3 separate experiments analyzing groups of 10 embryos. Error bars represent the standard error of the means. (B) Representative results of RFLP screening assay after injection of IDH1 P1 and GFP(GM2) P1. Open arrowheads indicate bands from completely digested WT PCR product and closed arrowheads represent uncut PCR product with small indels. *Marks single embryos with bi-allelic conversion.
Acknowledgments
This image is the copyrighted work of the attributed author or publisher, and
ZFIN has permission only to display this image to its users.
Additional permissions should be obtained from the applicable author or publisher of the image.
Full text @ PLoS One