
Image
|
Figure Caption
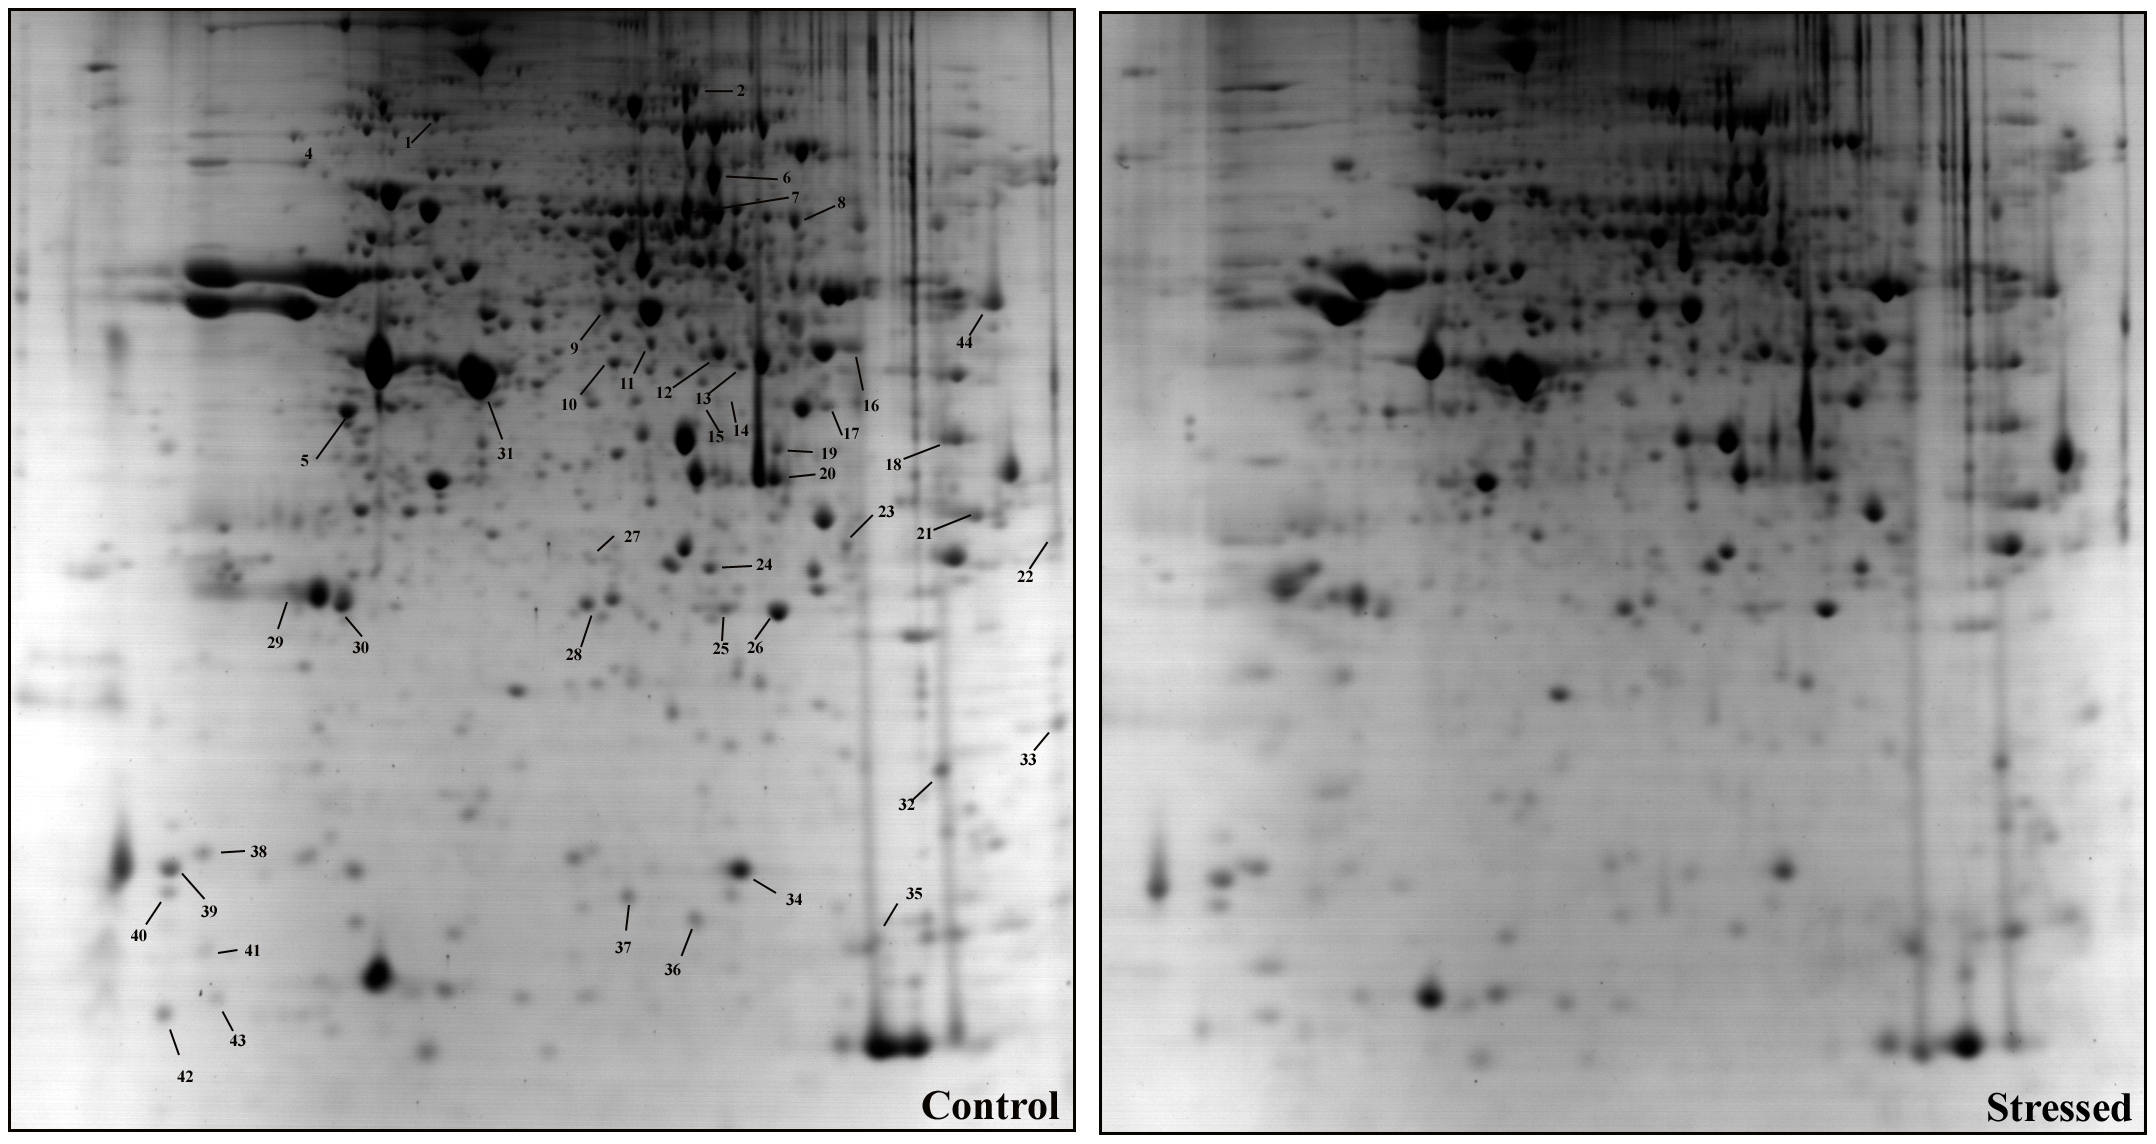
Fig. 3
Two-dimensional gel electrophoresis of zebrafish brain shows differential protein levels in response to CUS.
Two-dimensional gel electrophoresis pattern of zebrafish brain (a, control and b, stress group) visualized with fast Coomassie staining. Proteins were separated according to the pI gradient (x-axis) in the first dimension and the molecular weight in the second dimension (y-axis). Eighteen spots (labeled in control gel) were identified as differentially regulated under CUS and analyzed by tandem mass spectrometry (MS/MS).
Acknowledgments
This image is the copyrighted work of the attributed author or publisher, and
ZFIN has permission only to display this image to its users.
Additional permissions should be obtained from the applicable author or publisher of the image.
Full text @ PLoS One