
Fig. S2
- ID
- ZDB-IMAGE-130802-8
- Genes
- Publication
- Koltowska et al., 2013 - Ssrp1a controls organogenesis by promoting cell cycle progression and RNA synthesis
- All Figures
- Figures for Koltowska et al., 2013
|
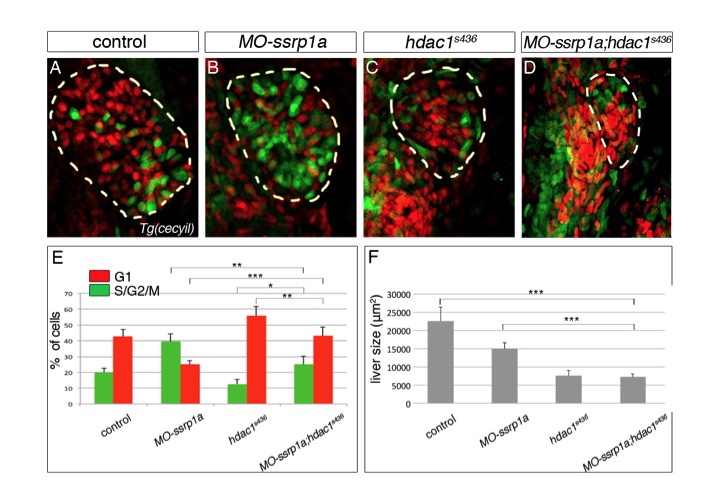
Fig. S2 Ssrp1a and Hdac1 are required in different phases of the cell cycle. (A-D) Transgenic cecyil expression marks the cell cycle dynamics in the liver (outlined in yellow; ventral views). Cells in G1 phase are in red and cells in S/G2/M phase in green. (E) Quantification of both populations in MO-ssrp1a and hdac1s436 reveal significant changes compared with controls (G1: MO-ssrp1a, P<0.001, hdac1s436, P<0.001; S/G2/M: MO-ssrp1a, P<0.001, hdac1s436, P<0.05). Enrichment of MO-ssrp1a cells in S/G2/M phase indicate DNA replication defects, whereas enrichment of Hdac1-deficient cells in G1 phase suggest impaired cell cycle progression. MO-ssrp1a;hdac1s436 embryos show a partial rescue of both populations compared with the individual loss-of-function phenotypes. (F) By contrast, liver size does not improve in MO-ssrp1a;hdac1s436embryos compared with MO-ssrp1a, hdac1s436 and control (F). *P<0.05, **P<0.01, ***P<0.001, determined by Student’s t-test. Error bars represent s.e.m.