
|
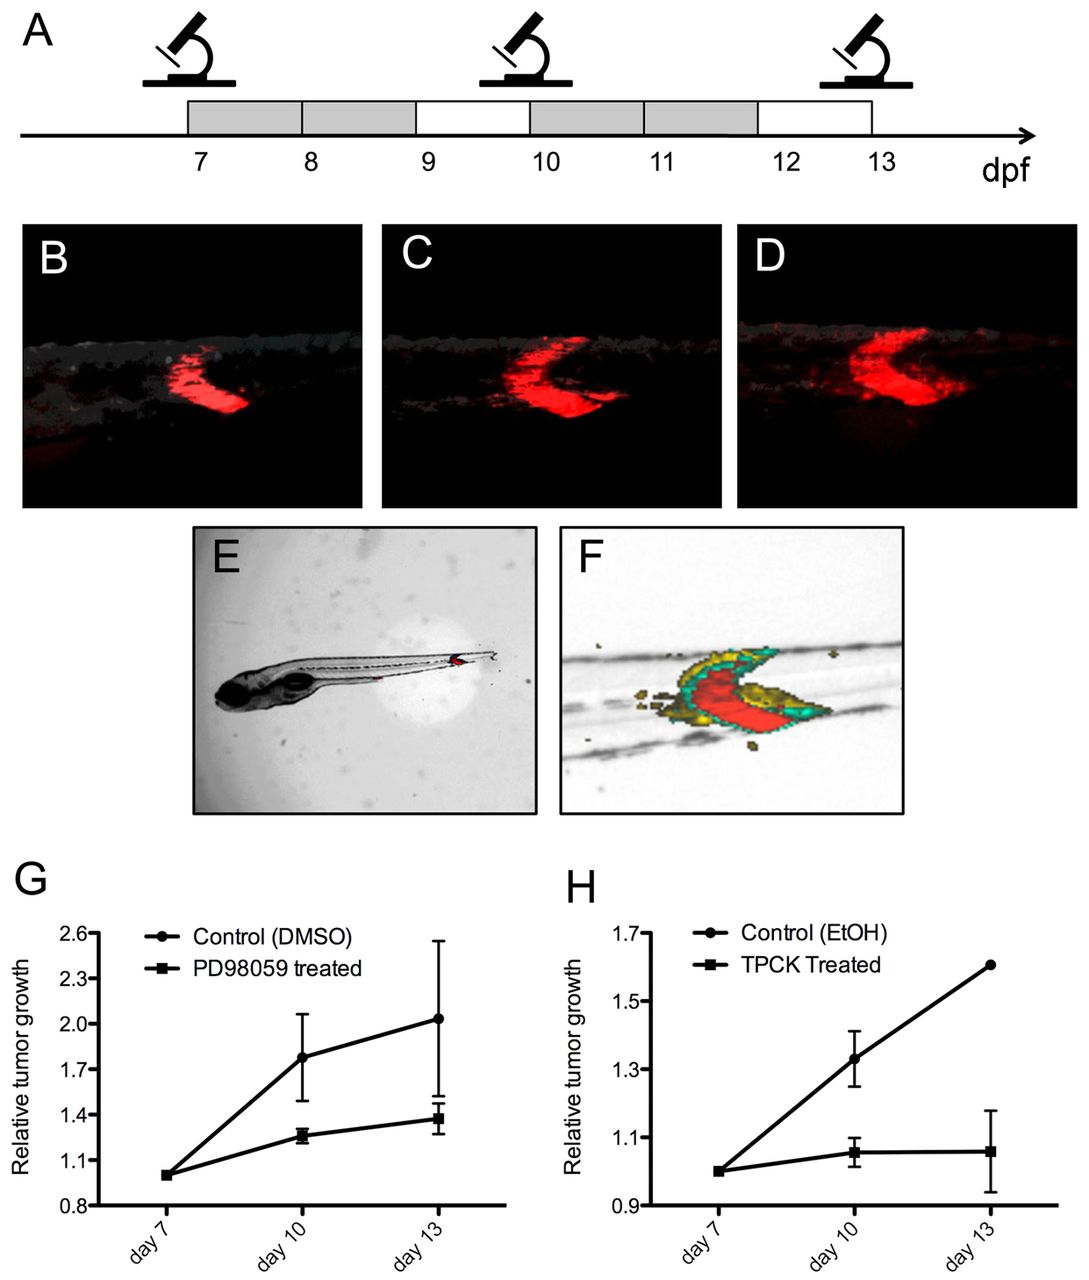
Fig. 3 PD98059 and TPCK inhibit tumor progression in rag2-KRASG12D-induced zebrafish ERMS. (A) Scheme of the analysis strategy. Photographs of tumors were taken under standardized conditions at days 7, 10 and 13. Gray boxes indicate days of chemical or control treatment; white boxes represent recovery days. (B-F) Images of a representative tumor-bearing fish receiving vehicle control (DMSO) treatment. (B-D) Images of the tumor area with DsRed fluorescence labeling RAS activation at 7 (B), 10 (C) and 13 (D) dpf. Photographs were taken with an exposure time of 3 seconds and gain of 80%. (E) The overall length of each fish (nose to tail) was also recorded under brightfield illumination at 7, 10 and 13 dpf to ensure the general health of fish. (F) Overlay of B-D, demonstrating the relative growth of the tumor (red, 7 dpf; green, 10 dpf; yellow, 13 dpf). (G,H) Relative tumor growth in fish treated with (G) PD98059 (15.6 μM) or (H) TPCK (0.3 μM) compared with vehicle (DMSO or ethanol) treated siblings (P<0.05, ANOVA, chemical compared with vehicle treatment). Error bars indicate s.e.m.