
|
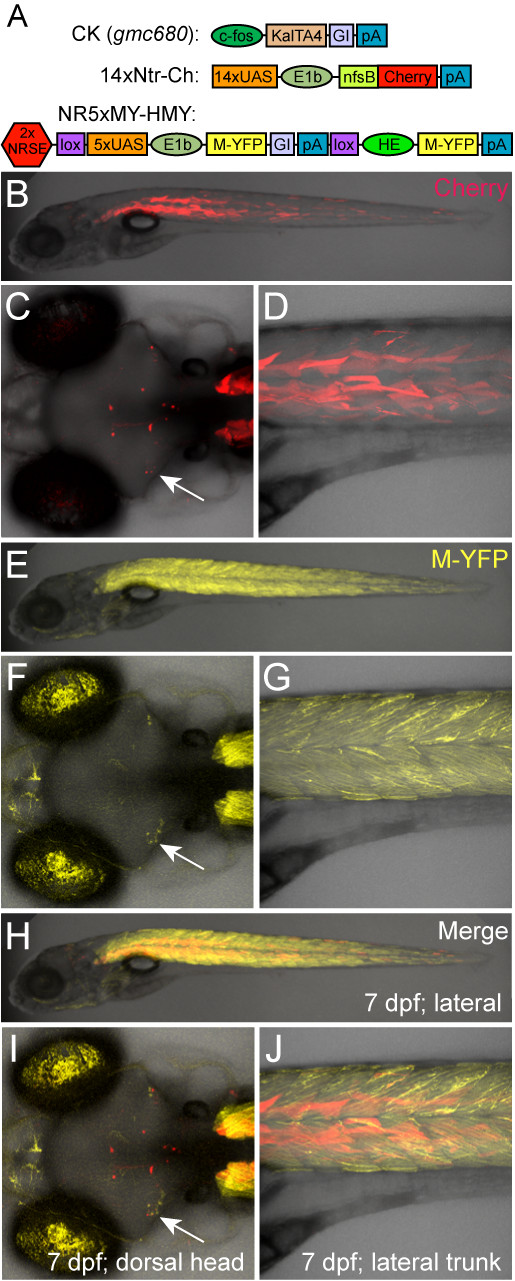
Fig. 3 UAS reporter comparison αNRSE. Plasmid diagrams and representative confocal images at 6 dpf of a triple transgenic larva where Gal4 is driving two reporters αNRSE, a non-NRSE mCherry reporter line (B-D, 14xNTR-Ch (c264)) and a NRSE-containing YFP reporter line (E-G, NR5xMY-HMY (gmc932), merged images H-J). (A) CK, 14xNtr-Ch and NR5xMY-HMY plasmid diagrams. (B-D) The control mCherry reporter (non-NRSE) shows a typical mixed expression pattern with neuronal subsets (C, arrow) and skeletal muscle labeling (D). (E-G) The NRSE-UAS YFP reporter showed expanded expression in skeletal muscle (compare D and G) and a similar pattern in the brain (F, arrow). Note that autofluorescence from iridiphores in the eye is also evident in the YFP emission channel. (H-J) Merged image showing that the addition of NRSE sites to UAS reporter plasmids is not sufficient to restrict reporter expression to the nervous system; i.e., the subset of neurons labeled in the brain (I, arrow). Presumably due to reduced silencing of the NR5xMY-HMY line, there is actually an expansion of YFP reporter expression throughout skeletal muscle.