
Fig. S3
- ID
- ZDB-IMAGE-130607-31
- Publication
- Kimura et al., 2013 - Hindbrain V2a Neurons in the Excitation of Spinal Locomotor Circuits during Zebrafish Swimming
- All Figures
- Figures for Kimura et al., 2013
|
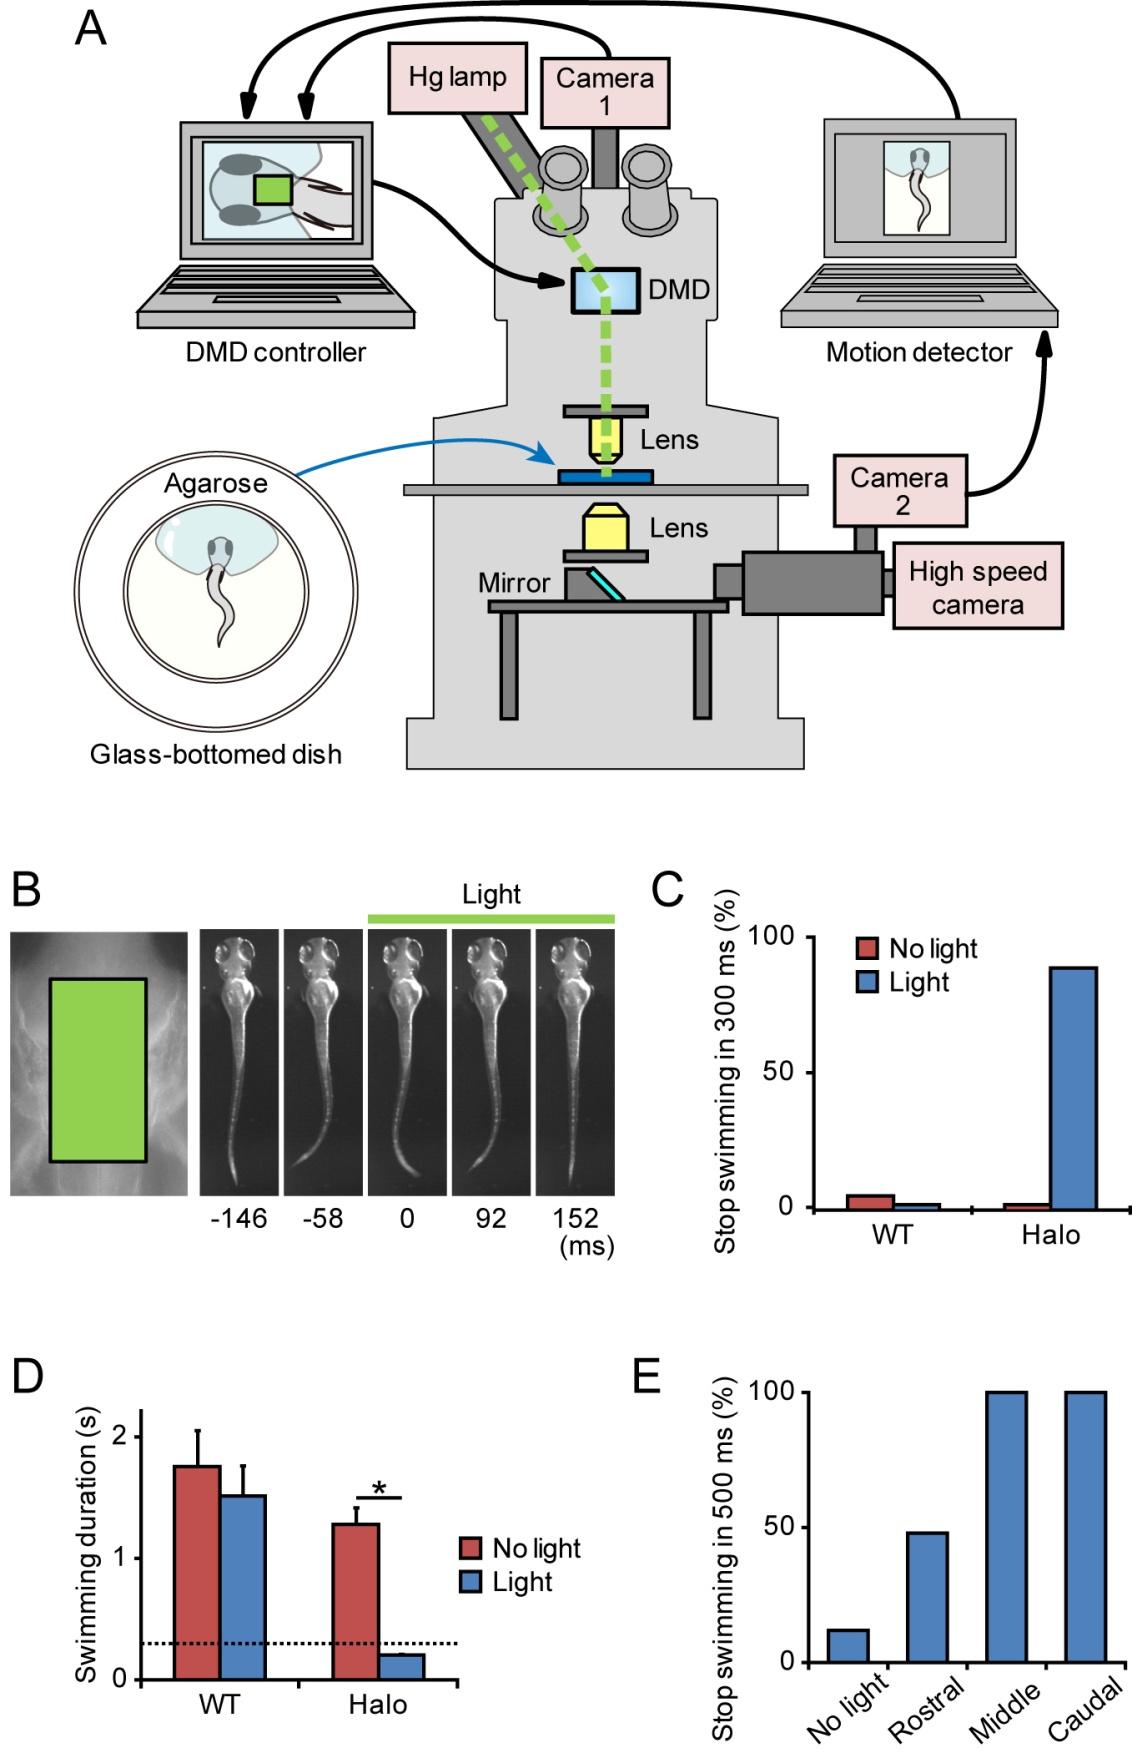
Fig. S3 Inactivation of hindbrain V2a neurons stops on-going swimming (A), A schematic of the experimental setup. The setup is essentially identical to that of the ChR photo-stimulation experiments (Fig. S2A), except that it contains a camera2 and computer for motion detection. The light-path from the bottom part is divided into two, with one reaching the high-speed camera and the other reaching camera2. Images of camera2 are digitized in the computer, and larval motion is detected. After detecting motion, an electronic signal is sent to the other computer (DMD controller) to start illumination by controlling DMD. (B) - (E), Inactivation of hindbrain V2a neurons with Halo3. Compound transgenic fish of Tg[chx10:Gal4] and Tg[UAS:Halo3] at 3 dpf were used in the experiments. (B), (C), and (D), Green light (7.6 mW/mm2, 300 ms) was applied to the boxed area (left panel in B) after swimming started (onset latency of the illumination was 200–400 ms). The application of the light stopped swimming (right panels in B). (C), Frequencies of stopping swimming within the illumination periods (300 ms). “WT” represents wild-type larvae, whereas “Halo” represents larvae that expressed Halo3 in V2a neurons. “No light” represents control experiments in which green light was not applied. In these cases, the duration of swimming was measured after the onset of the electric signal that would turn on illumination with the DMD. In 90% of the trials, illumination of the green light stopped on-going swimming in Halo3-expressing larvae. Halo3: n = 27, 6 animals; WT: n = 25, 6 animals. (D), Mean duration of swimming after the onset of illumination. Bars indicate SE. The dotted line indicates illumination time. In the case of Halo3-expressing larvae, the duration of swimming was significantly shorter (t-test; *p <0.001). Halo3: n = 27, 6 animals; WT: n = 25, 6 animals. (E), Green light (7.6 mW/mm2, 500 ms) was applied in a region-specific manner. Illumination areas are the same as the ones shown in Figure 3D. Frequencies of stopping swimming within the illumination periods (500 ms) are shown. “No light” represents control experiments in which green light was not applied. n = 25, 7 animals.