
Fig. 2
- ID
- ZDB-IMAGE-130515-1
- Publication
- Grisham et al., 2013 - Mutations in ap1b1 Cause Mistargeting of the Na(+)/K(+)-ATPase Pump in Sensory Hair Cells
- All Figures
- Figures for Grisham et al., 2013
|
Fig. 2
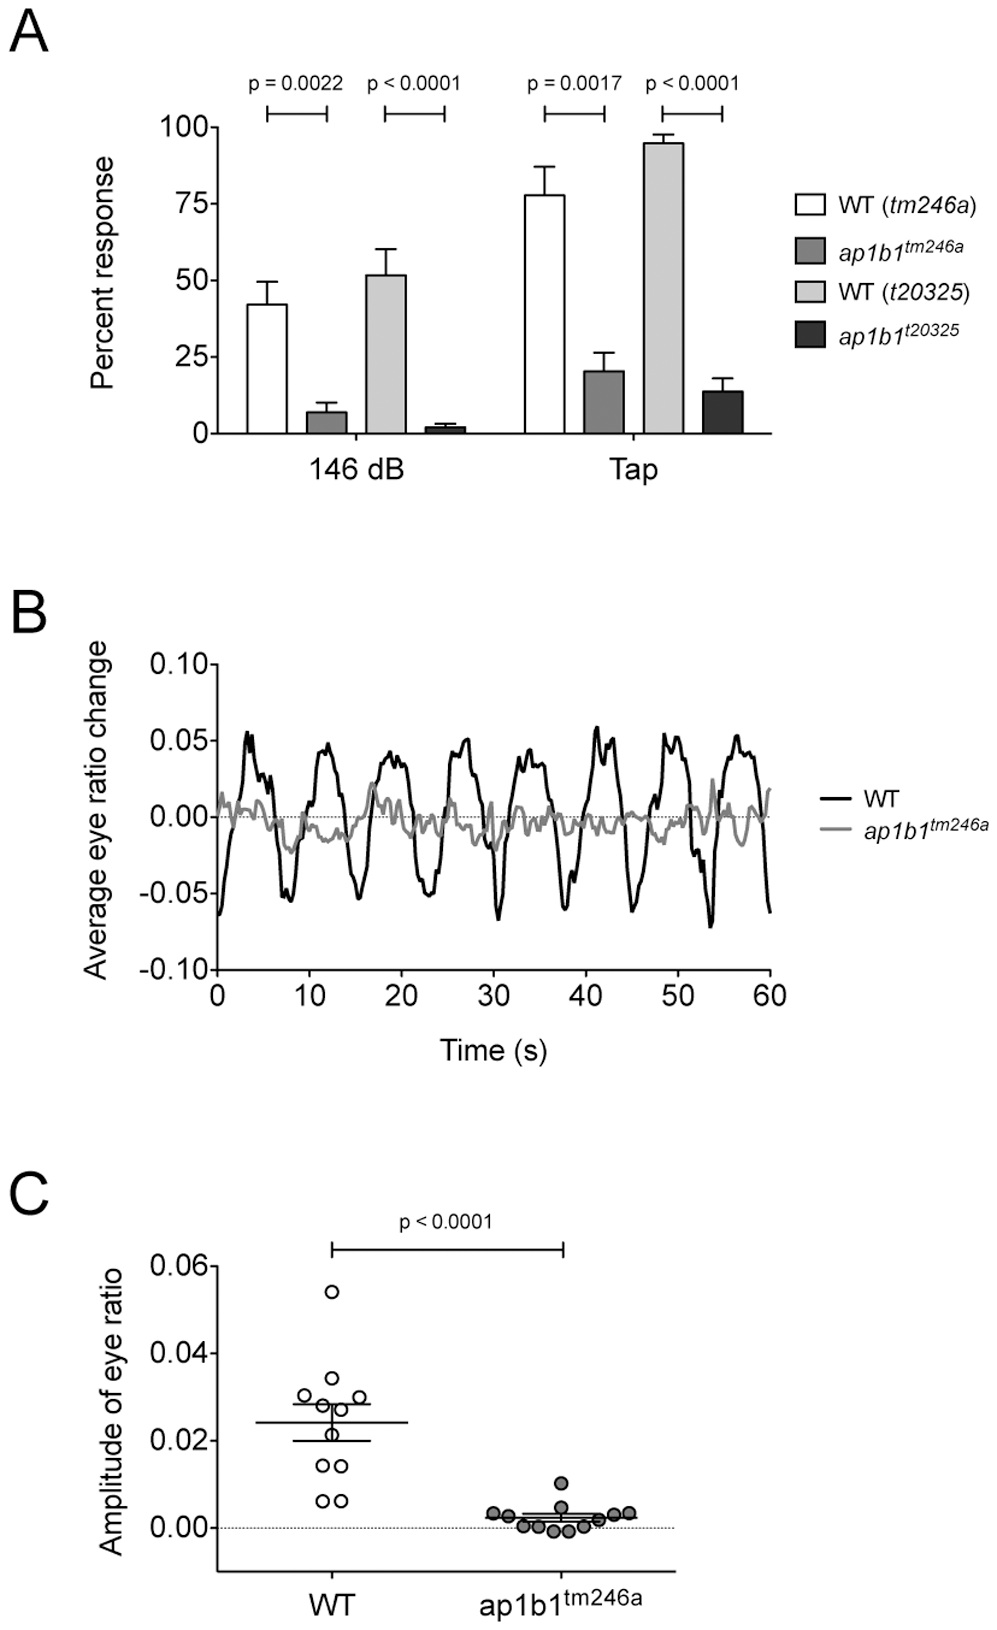
Figure 2. ap1b1 mutants have deficits in auditory and vestibular behavioral responses.
A, Graph showing the average startle response to either a 1000Hz stimulus at 146 dB or a tap stimulus of both mutants (tm246a: n = 9, t20325: n = 23) and their WT siblings (tm246a: n = 15, t20325: n = 19). B, Averaged traces of vestibular-induced eye movements from WT siblings (n = 11) and tm246a mutants (n = 12) over 60 sec. C, Average of peak amplitude of vestibular-induced eye movements at 0.25 Hz. Each dot represents one eye from an individual larva at 5 dpf (WT: n = 11, tm246a: n = 12). A Mann-Whitney U-test was used to compare differences between mutants and WT siblings.