
IMAGE
Fig. S4
- ID
- ZDB-IMAGE-130507-14
- Publication
- Basten et al., 2013 - Mutations in LRRC50 Predispose Zebrafish and Humans to Seminomas
- All Figures
- Figures for Basten et al., 2013
Image
|
Figure Caption
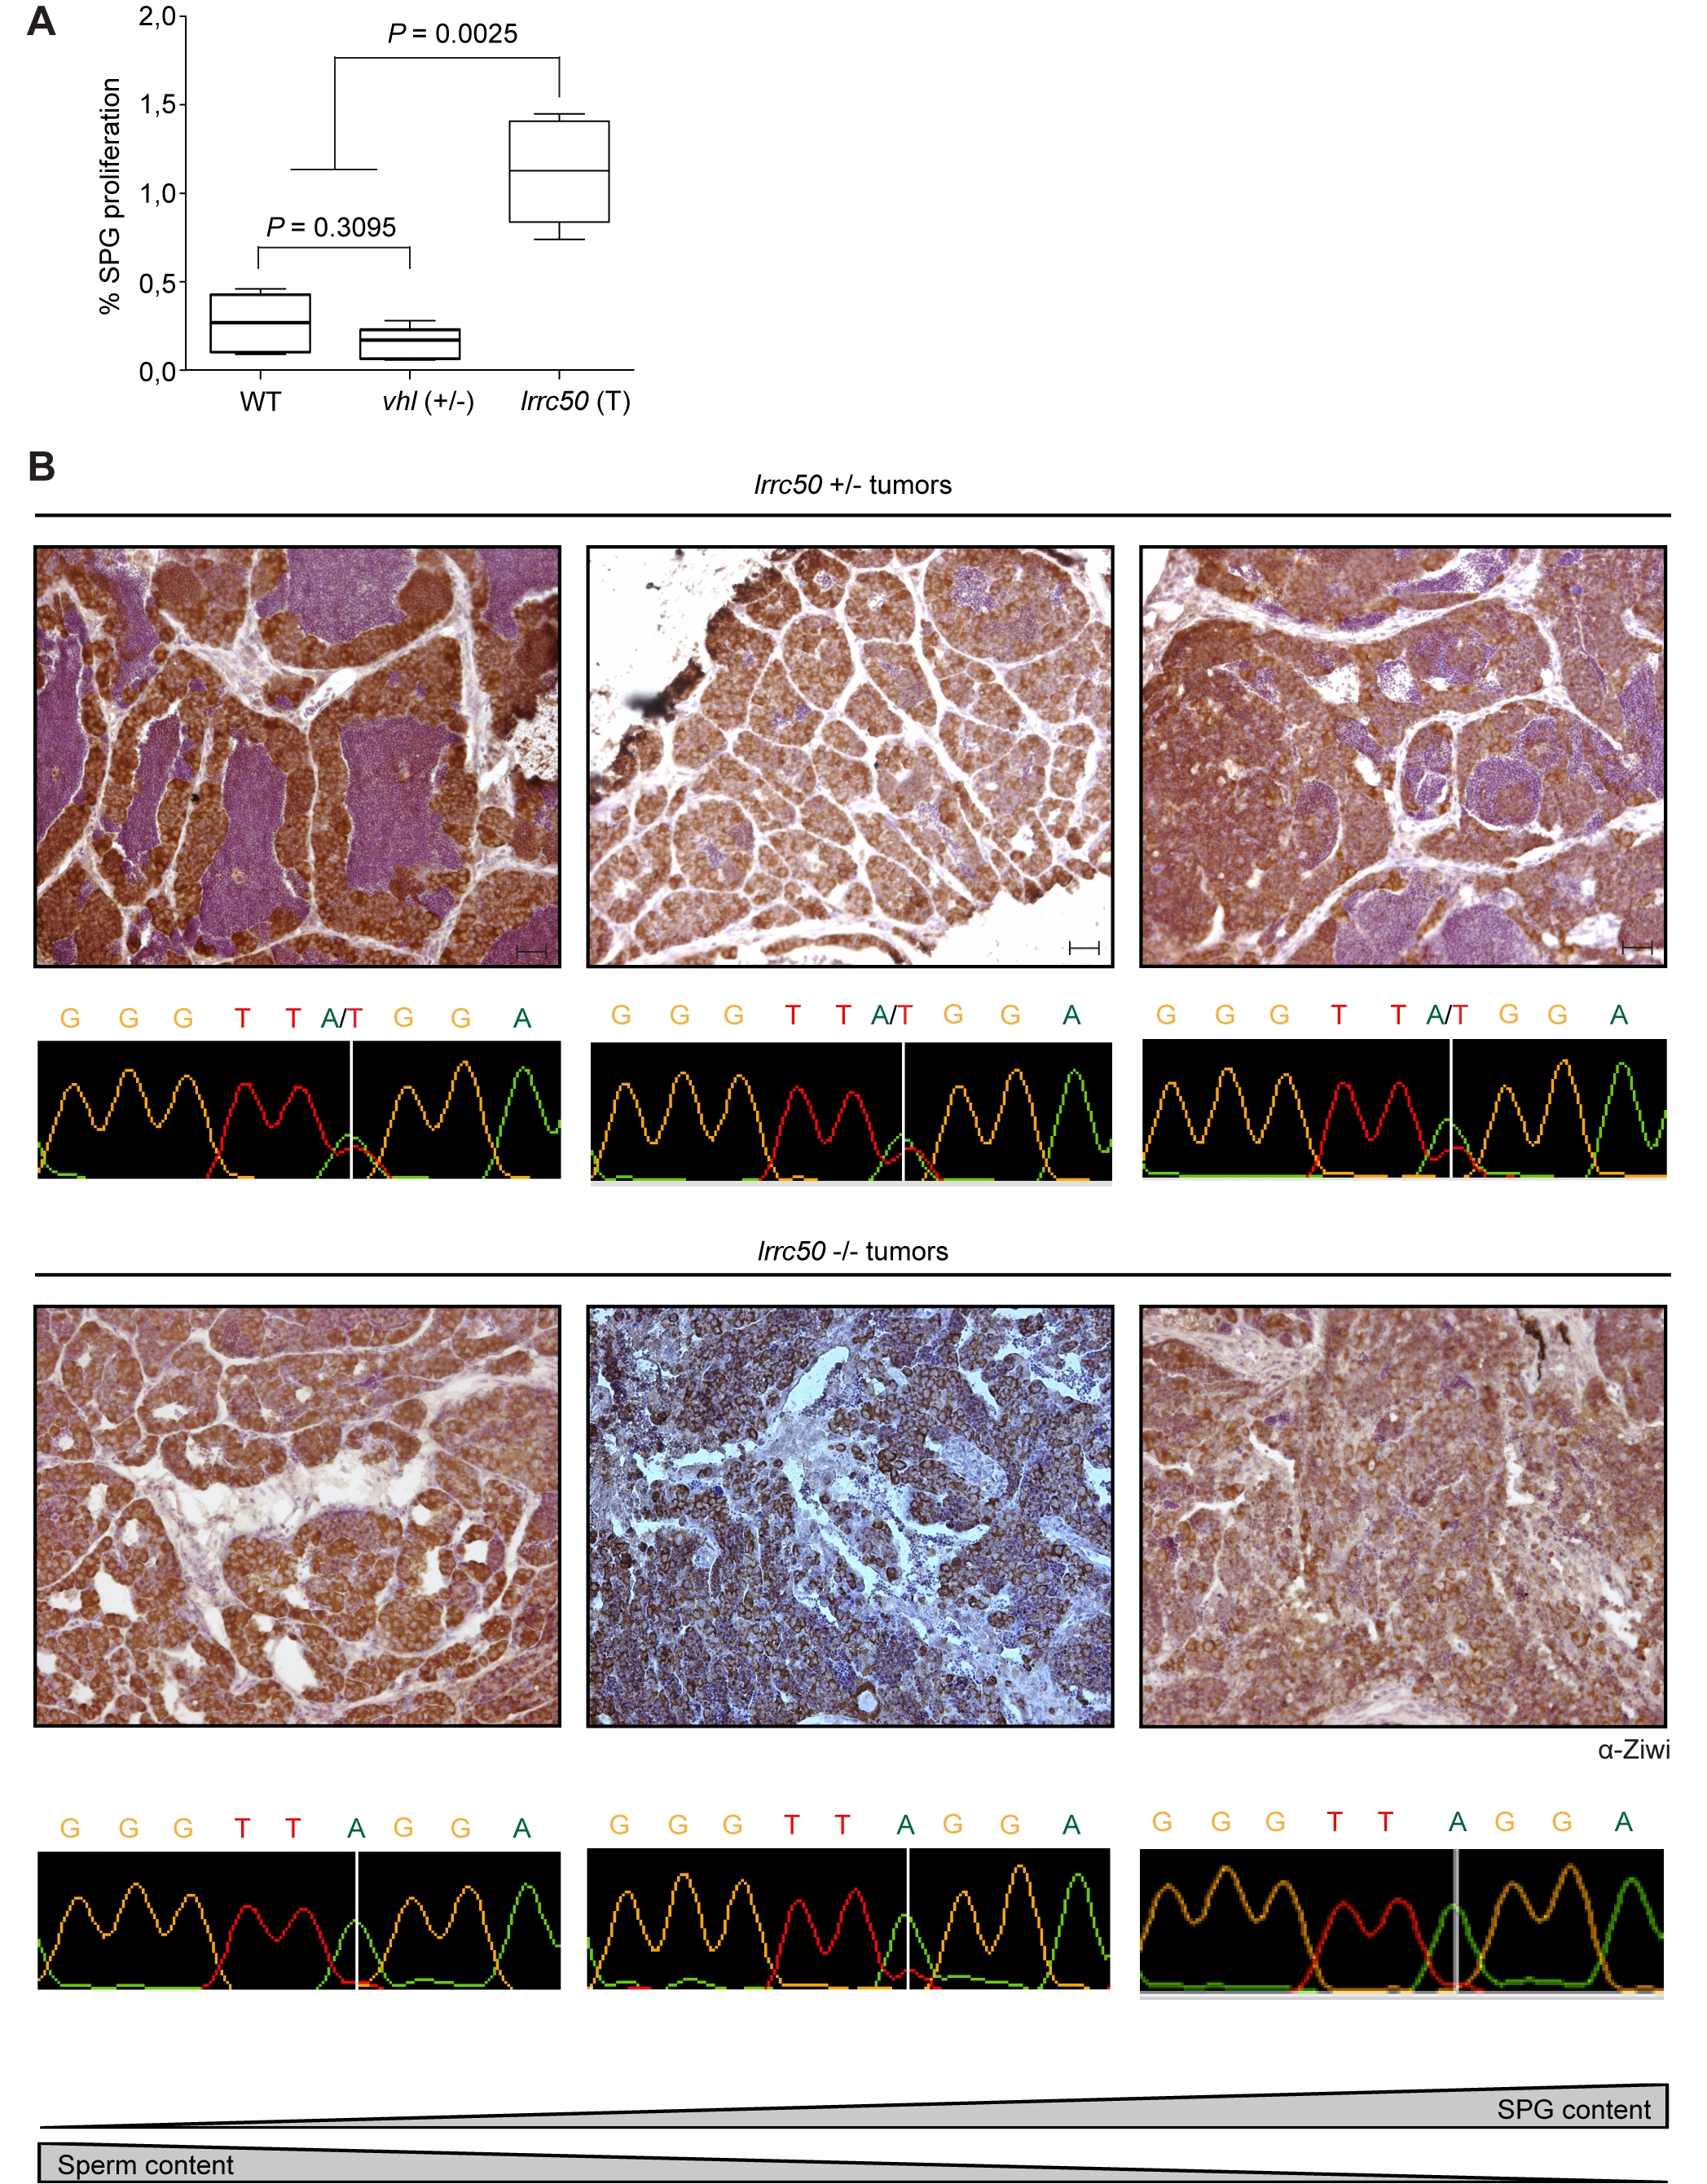
Fig. S4
Zebrafish lrrc50Hu255h tumor proliferation and genotyping various stages of tumor progression. (A) Quantification of single stem cell proliferation from phospho-HistoneH3 staining; lrrc50+/ (T; tumors, n = 7), wt (n = 5) and age-matched vhl+/ (n = 4). Statistical analysis was performed using a non-parametric Mann-Whitney test at P<0.05. (B) Analysis of the tumor progression, defined by SPG content determined by α-Ziwi IHC and morphologically identifiable sperm content, correlates with increased biallelic loss indicated by tumor genotypes. Scale bars; 50 μm.
Acknowledgments
This image is the copyrighted work of the attributed author or publisher, and
ZFIN has permission only to display this image to its users.
Additional permissions should be obtained from the applicable author or publisher of the image.
Full text @ PLoS Genet.