
Fig. S1
- ID
- ZDB-IMAGE-130502-9
- Publication
- Song et al., 2013 - Pou5f1-dependent EGF expression controls e-cadherin endocytosis, cell adhesion, and zebrafish epiboly movements
- All Figures
- Figures for Song et al., 2013
|
Fig. S1
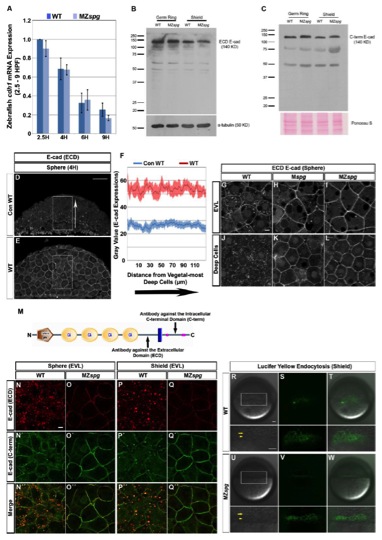
E-cad Expression and YSL Endocytic Band Phenotypes in Pou5f1-deficient Embryos
(Related to Figure 1)
(A) Time series qRT-PCR data of cdh1 mRNA expression in WT and MZspg embryos from 2.5 to 9 hpf. cdh1 expression values were normalized using ef1α; qRT-PCR. The cdh1 expression in WT embryos at 2.5 hpf was set to 1. The cdh1 mRNA amount decrease steadily during development (2.5, 4, 6, and 9 hpf) both in WT and MZspg embryos; however, cdh1 expression is not significantly different in MZspg embryos compared to WT (n = 3; Error bars represent standard error of the mean (SEM)).
(B-C) E-cad protein amounts in germ ring and shield stage whole embryo extracts analyzed by Western blot analysis using E-cad antibodies to extracellular-domain (B) and intracellular-domain (C). E-cad protein amounts of those two stages are not significantly different in WT and MZspg embryos. E-cad is detected as most prominent protein band at 140 KD. α-tubulin detected by antibody and Ponceau S were used as loading controls.
(D-F) Immunodetection of E-cad distribution in semi-thin paraffin sections of WT (E) embryos at sphere stage by confocal imaging. (D) Control WT shows a WT embryo stained only with a secondary antibody. Lateral views, animal pole to the top. (F) The immunofluorescence signal was measured in the highlighted rectangles along the animal-vegetal axis and intensities at same animal-vegetal positions were averaged. The plot profile represent values along interior/vegetal to exterior/animal axis (see arrow) measured as average gray levels. The background stain intensity in absence of E-cad antibody in control WT (26.5± 2.2) and in E-cad immunostained WT (53.4± 4.2) embryos are not significantly different when signal interior/vegetal and exterior/animal layers were compared (n=8 sections each). Therefore E-cad appears to be homogenously distributed along the animal-vegetal axis in the whole deep cell layer in WT embryos (E). We could not detect the previously postulated animal-vegetal E-cad protein gradient (Kane et al., 2005). Error bars represent standard error of the mean (SEM). Scale bar = 50 μm.
(G-L) E-cad subcellular localization in WT (G and J), Mspg (H and K), and MZspg (I and L) embryos at sphere stage. Shown are confocal images of anti-E-cad ECD immunofluorescence whole mount embryos. Scale bar = 10 μm.
(M) Schematic representation showing detection sites of two different antibodies and the predicted protein domains (SMART, EMBL-Heidelberg) of zebrafish E-cad. The extracellular domain (ECD)-specific rabbit polyclonal antibody (Babb and Marrs, 2004) detects an antigen located between the cadherin repeats and the transmembrane domain, while the intracellular C-terminal domain-specific (C- 4 term) monoclonal clone 36/E-Cad antibody detects the antigen located in the middle of the cytoplasmic domain.
(N-Q′ ′) Co-immunofluorescence of E-cad with ECD (red) and C-terminal (green) specific antibodies in WT and MZspg embryos at sphere and shield stages. In WT embryos the C-term E-cad antibody (N′ and P′) detects less intracellular E-cad signal than the ECD E-cad antibody (N and P). Both antibodies detect predominant cell membrane localization of E-cad in MZspg embryos (O and Q; O′ and Q′). Merged channels indicate that the signals detected by both antibodies are colocalized despite different relative intensities of membrane and vesicular signals (N′ ′-O′ ′ and P′ ′-Q′ ′). It appears that in WT embryos, the C-terminal antibody recognizes the cell-membrane localized E-cad more efficiently than the vesicular form, when compared to the ECD E-cad antibody. Colocalization analysis confirms that both antibodies recognize the same antigen. The C-terminal antibody also visualized the prominent shift of E-cad to cell-membrane localization in MZspg embryos. Animal pole views. Scale bar = 10 μm.
(R-W) Live WT (R-T) and MZspg (U-W) embryos are shown at shield stage following incubation in 1.5% Lucifer Yellow medium. A circumferential band of endocytic vesicles in the YSL (arrowheads) positioned beneath the vegetal front of the blastoderm is visualized (arrows). Higher magnification views of the boxed areas are shown below. Lateral views, animal pole to the top. Scale bars = 50 μm.
Reprinted from Developmental Cell, 24(5), Song, S., Eckerle, S., Onichtchouk, D., Marrs, J.A., Nitschke, R., and Driever, W., Pou5f1-dependent EGF expression controls e-cadherin endocytosis, cell adhesion, and zebrafish epiboly movements, 486-501, Copyright (2013) with permission from Elsevier. Full text @ Dev. Cell