
Fig. 2
- ID
- ZDB-IMAGE-130502-13
- Antibodies
- Publication
- Song et al., 2013 - Pou5f1-dependent EGF expression controls e-cadherin endocytosis, cell adhesion, and zebrafish epiboly movements
- All Figures
- Figures for Song et al., 2013
|
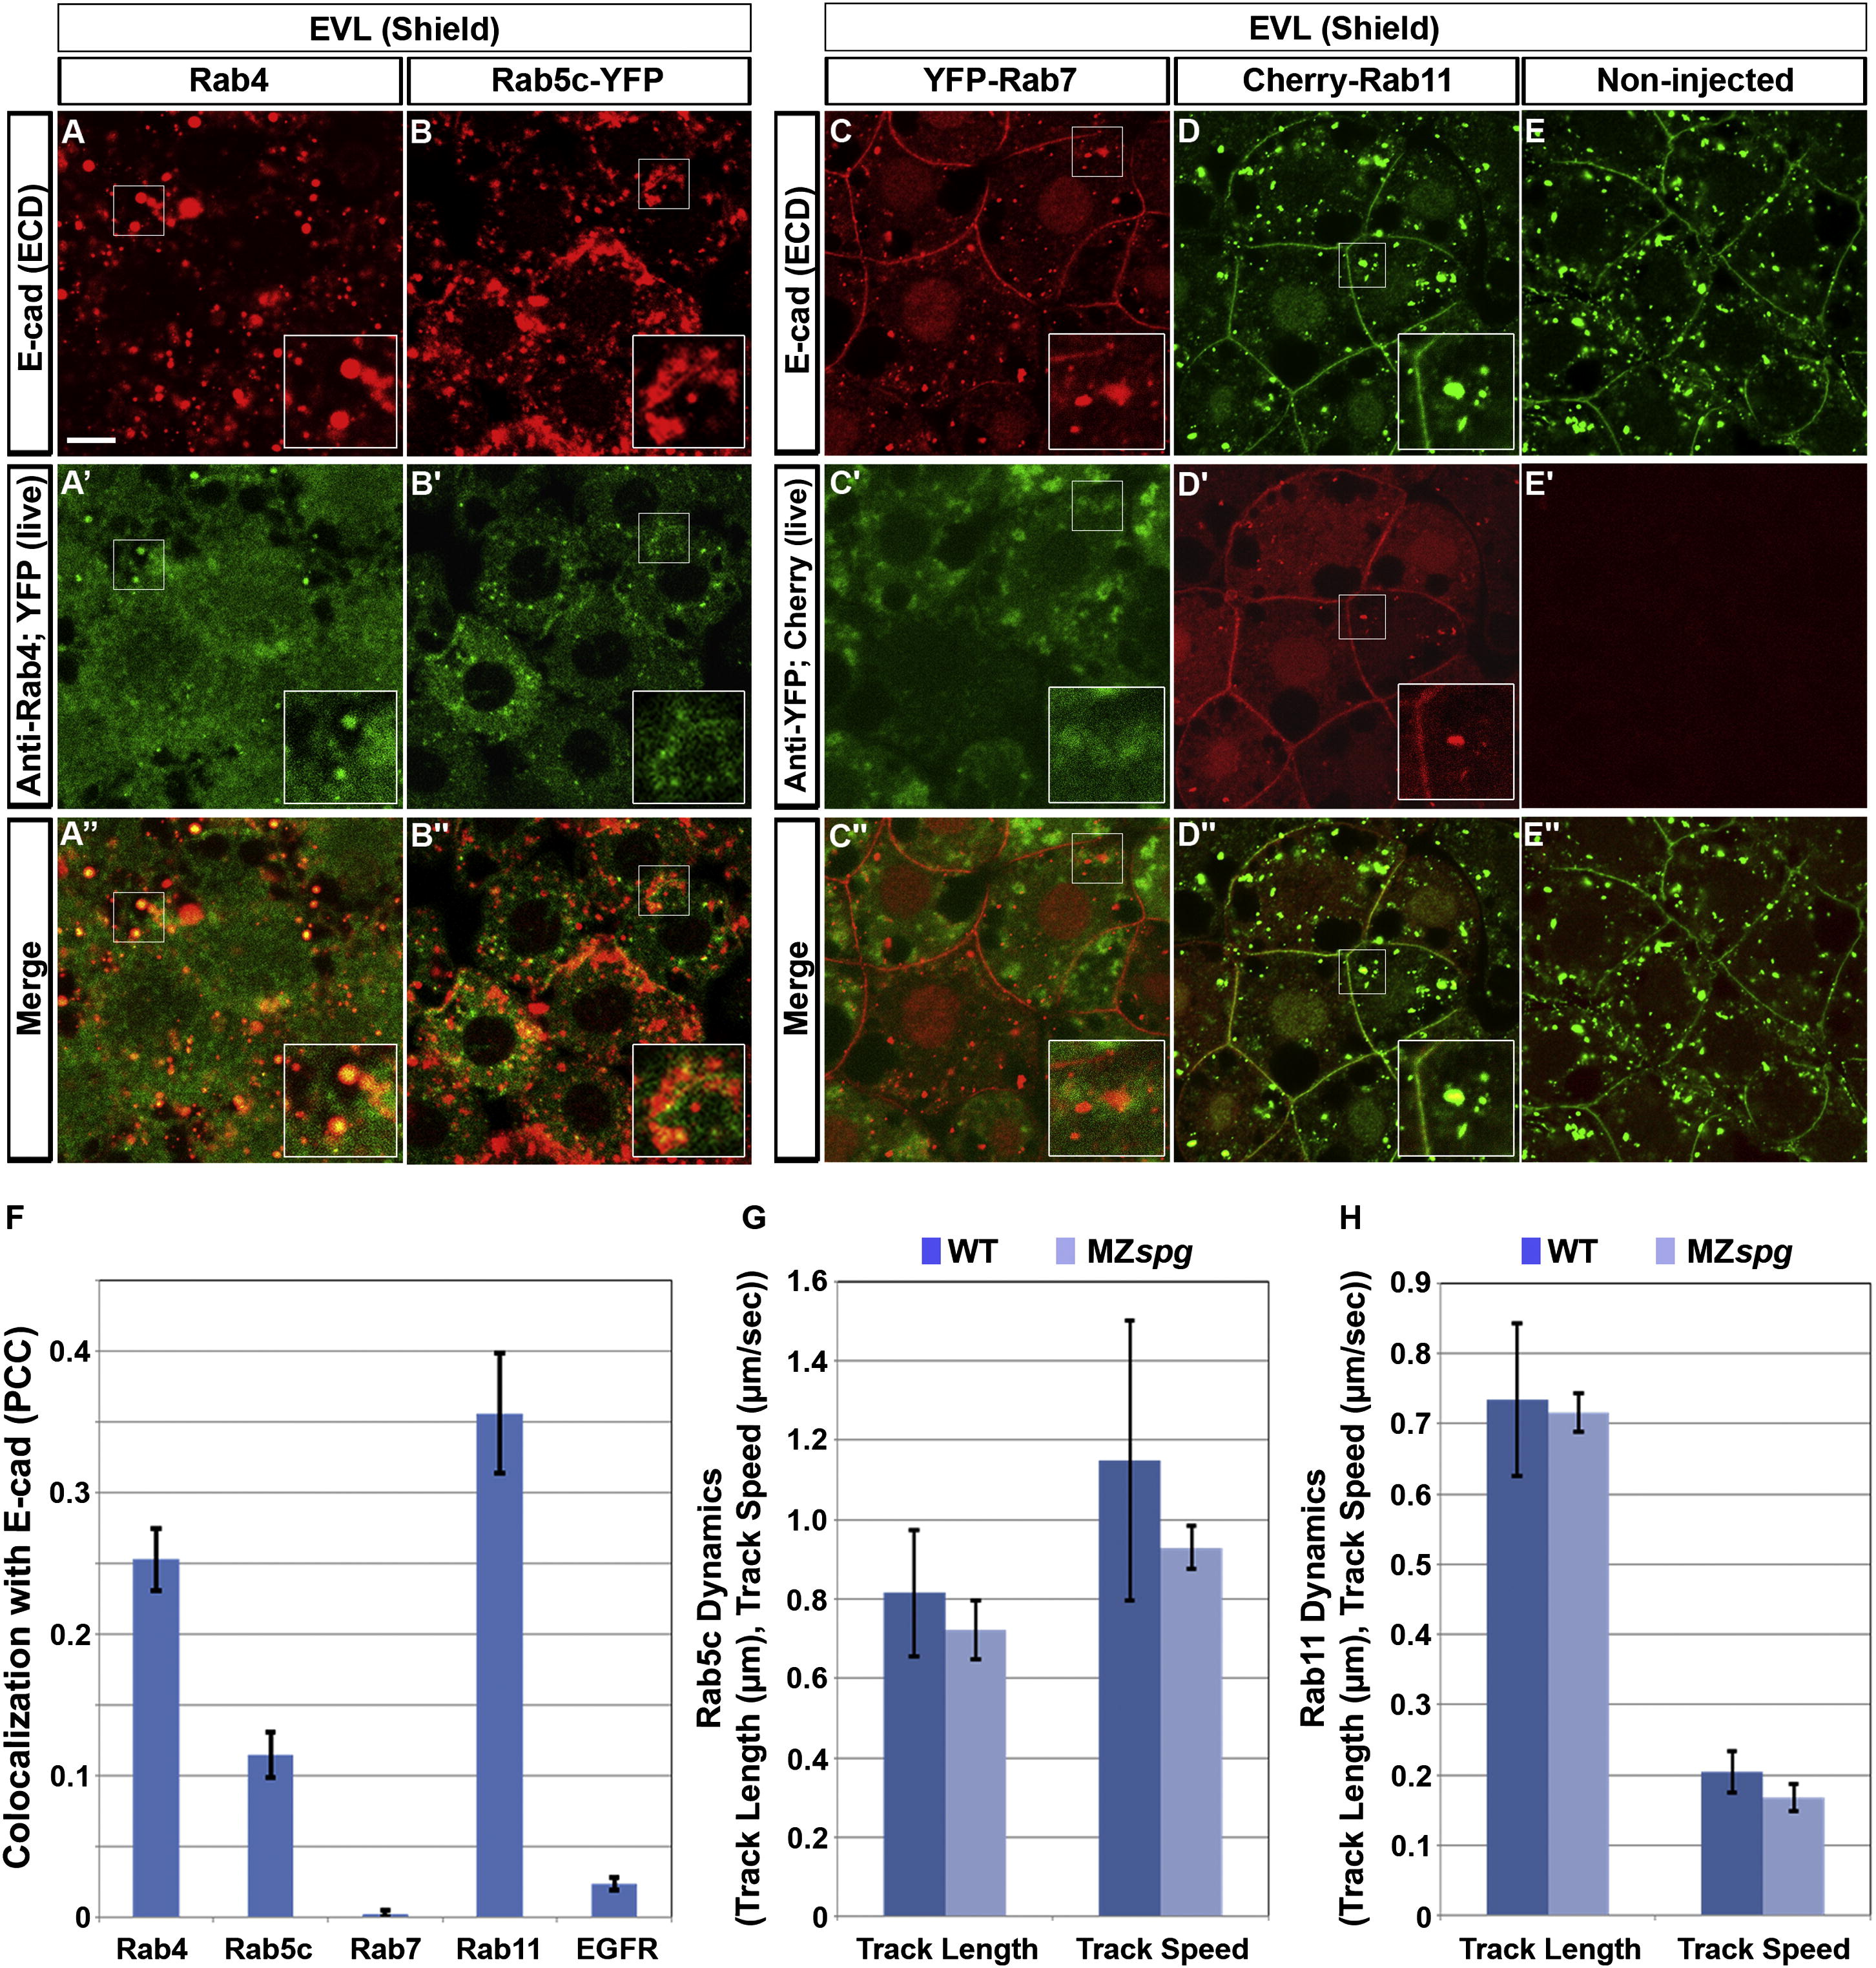
Fig. 2 E-cad Colocalizes with Rab4, 5c, and 11, but Not with Rab7-Positive Endosomes(A–E′′) Double immunofluorescence for ECD E-cad (A and C) and Rab4 (A′) or YFP-Rab7 fusion protein (C′), and colocalization of ECD E-cad immunofluorescence (B and D) and Rab5c-YFP or Cherry-Rab11 direct fluorescence (B′ and D′) in EVL cells of shield stage WT embryos. (E–E′′) Noninjected control WT embryos. Insets show higher magnification views of boxed areas. Animal views. Scale bar, 10 μm.(F) Evaluation of colocalization of signals. 25.2% ± 2.1% of Rab4 signal (A′′, n = 12 embryos), 11.4% ± 1.6% of Rab5c signal (B′′, n = 14 embryos), 0.2% ± 0.1% of Rab7 signal (C′′, n = 16 embryos), 35.5% ± 4.2% of Rab11 signal (D′′, n = 9 embryos), or 2.3% ± 0.4% of EGFR signal (see Figure S4, n = 39 embryos) colocalize with E-cad signal. Error bars show SEM. (G and H) Endosomal dynamics. The average track length and mean track speed of Rab5c-YFP (G; n = 14 embryos each in WT and MZspg) and Cherry-Rab11 (H; n = 7 embryos each in WT and MZspg) endosomes in WT and MZspg embryos were measured from time-series recordings (Movie S2). Error bars show SD.See also Figure S2 and Movie S2.
Reprinted from Developmental Cell, 24(5), Song, S., Eckerle, S., Onichtchouk, D., Marrs, J.A., Nitschke, R., and Driever, W., Pou5f1-dependent EGF expression controls e-cadherin endocytosis, cell adhesion, and zebrafish epiboly movements, 486-501, Copyright (2013) with permission from Elsevier. Full text @ Dev. Cell