
Fig. 7
- ID
- ZDB-IMAGE-130429-40
- Genes
- Publication
- Wolf et al., 2013 - Specification of posterior hypothalamic neurons requires coordinated activities of Fezf2, Otp, Sim1a and Foxb1.2
- All Figures
- Figures for Wolf et al., 2013
|
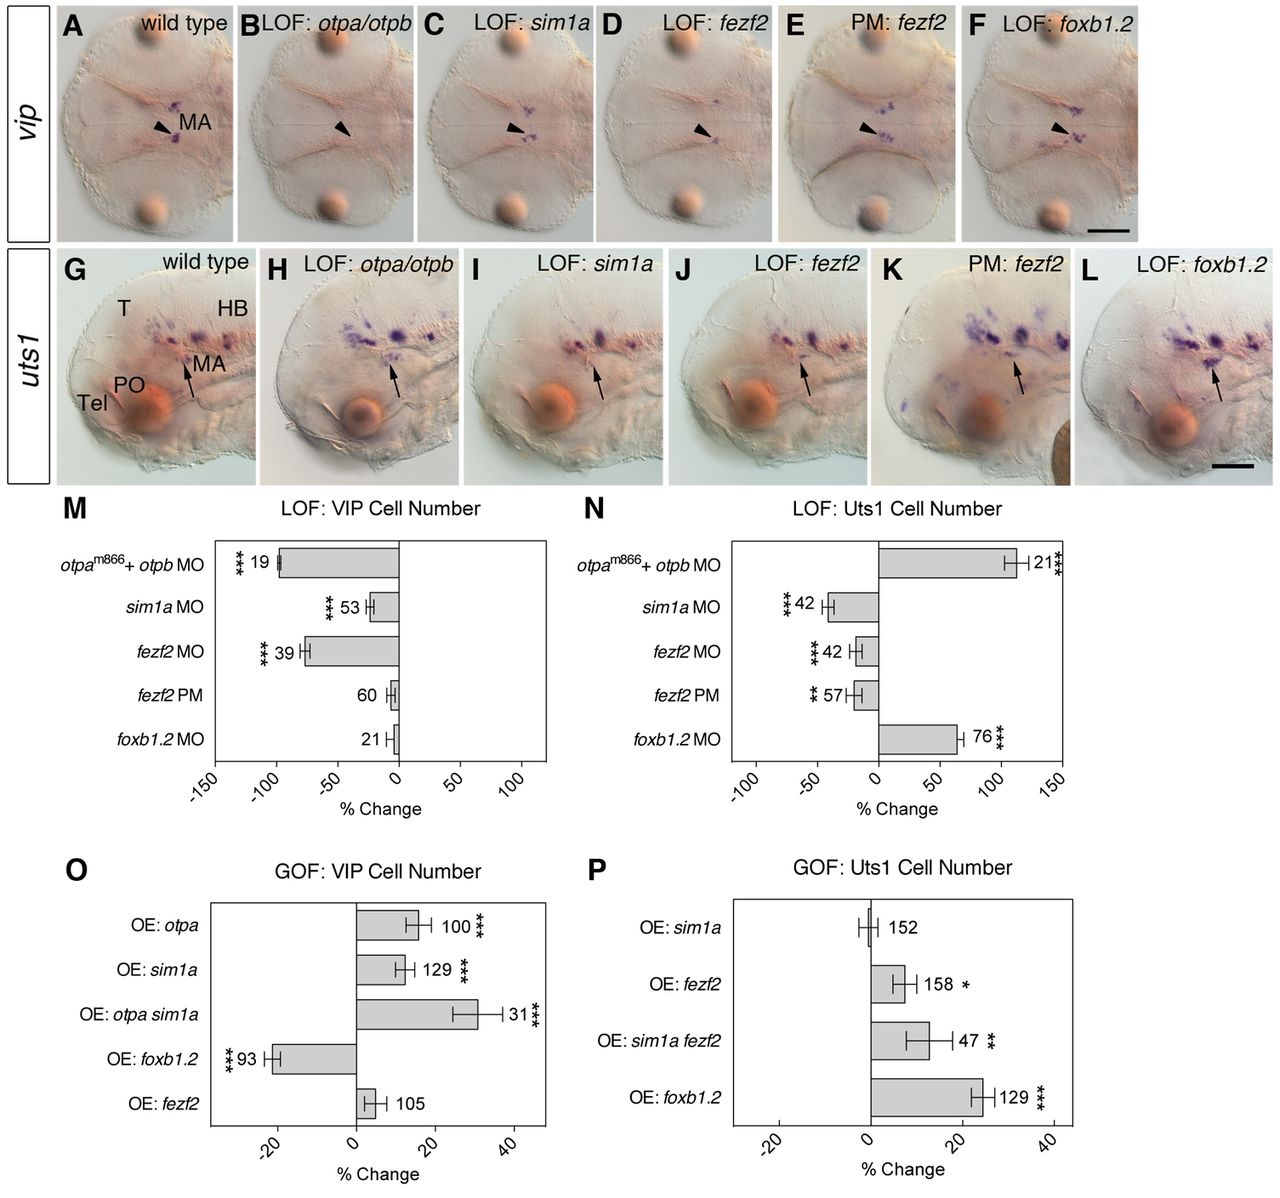
Fig. 7 Transcription factor requirements and sufficiency for Vip- and Uts1-positive neuron specification. (A-L) vip and uts1 WISH at 2 dpf (A-F) and 3 dpf (G-L) in wild-type zebrafish embryos (A,G), otpam866 mutant embryos injected with 4 ng otpb MO (B,H) and wild-type embryos injected with 1 ng sim1a MO (C,I), 4 ng fezf2 MO (D,J), 4 ng fezf2 MO caged with PhotoMorph (PM) until 1 or 2 dpf (E,K) and 8 ng foxb1.2 MO (F,L). Dorsal (A-F) and lateral (G-L) views are shown. (A-F) vip expression in the MA (arrowheads) is reduced in embryos with loss of Otp (B; n=19/19), Sim1a (C; n=30/53) and Fezf2 (D; n=37/39) activity. (E) Embryos with fezf2 PM uncaged at 1 dpf (n=60/60) and foxb1.2 morphants (F; n=20/20) show no changes in vip expression. (G-L) The expression of uts1 in the MA (arrows) is upregulated in embryos that lack Otp function (H; n=21/21) whereas it is downregulated in sim1a (I; n=29/42) and in fezf2 (J; n=17/42) morphants. (K) Uncaging of the fezf2 PM at 2 dpf resulted in a reduction of uts1 expression (n=32/57). (L) The loss of Foxb1.2 function leads to an expansion of the uts1-positive cells (n=58/76). (M-P) Percentage change in the number of Vip-positive (M,O) and Uts1-positive (N,P) neurons in loss-of-function embryos compared with uninjected wild-type embryos (M,N) and in transgenic embryos overexpressing cDNAs for otpa, sim1a, fezf2 or foxb1.2 compared with heat shocked wild-type embryos (O,P). Cell number changes were compared with the theoretical median cell number of wild-type embryos and analyzed using the Wilcoxon signed rank test. At 2 dpf, the number of Vip-positive cells in wild-type embryos has median and mean (±s.e.m.) values of 14 and 14.6±0.36, respectively. (M) The loss of Otp, Sim1a and Fezf2 function leads to a reduction in VIP cell number in the MA compared with wild-type embryos, whereas the uncaged fezf2 PM and the foxb1.2 morphants show no difference compared with the wild type (P=0.0812 and P=0.7423, respectively). (N) The number of Uts1-positive cells in wild-type embryos has median and mean values of 8 and 8.5±0.22, respectively. Embryos lacking Otp and Foxb1.2 activity have an increased number of Uts1-positive cells, whereas the loss of Sim1a, Fezf2 and the uncaged fezf2 PM leads to a reduction. (O,P) Heat shocked wild-type embryos have median and mean values of 13 and 12.8±0.17 Vip-positive cells, respectively. (O) Overexpression of Otpa and Sim1a leads to a higher number of Vip-positive cells. Combined overexpression of Otpa and Sim1a also leads to a higher number of Vip-positive cells, whereas overexpression of Foxb1.2 results in a lower number of Vip-positive cells. Overexpression of Fezf2 led to no change in the number of Vip-positive cells (P=0.2170). (P) The number of Uts1-positive cells in heat shocked wild-type embryos has median and mean values of 9 and 8.8±0.19, respectively. Overexpression of Fezf2, a combination of Fezf2 and Sim1a, and Foxb1.2 leads to a higher number of Uts1-positive cells at 3 dpf in the MA compared with the wild type, whereas overexpression of Sim1a showed no change in the number of Uts1-positive cells (P=0.5645). *P<0.05, **P<0.01, ***P<0.001; error bars indicate s.e.m. The number of embryos analyzed is shown alongside each bar. T, tectum; Tel, telencephalon; PO, preoptic area; MA, mammillary area; HB, hindbrain; LOF, loss-of-function; GOF, gain-of-function; PM, PhotoMorph. Scale bar: 100 μm.