
Fig. S16
- ID
- ZDB-IMAGE-130429-29
- Publication
- Wolf et al., 2013 - Specification of posterior hypothalamic neurons requires coordinated activities of Fezf2, Otp, Sim1a and Foxb1.2
- All Figures
- Figures for Wolf et al., 2013
|
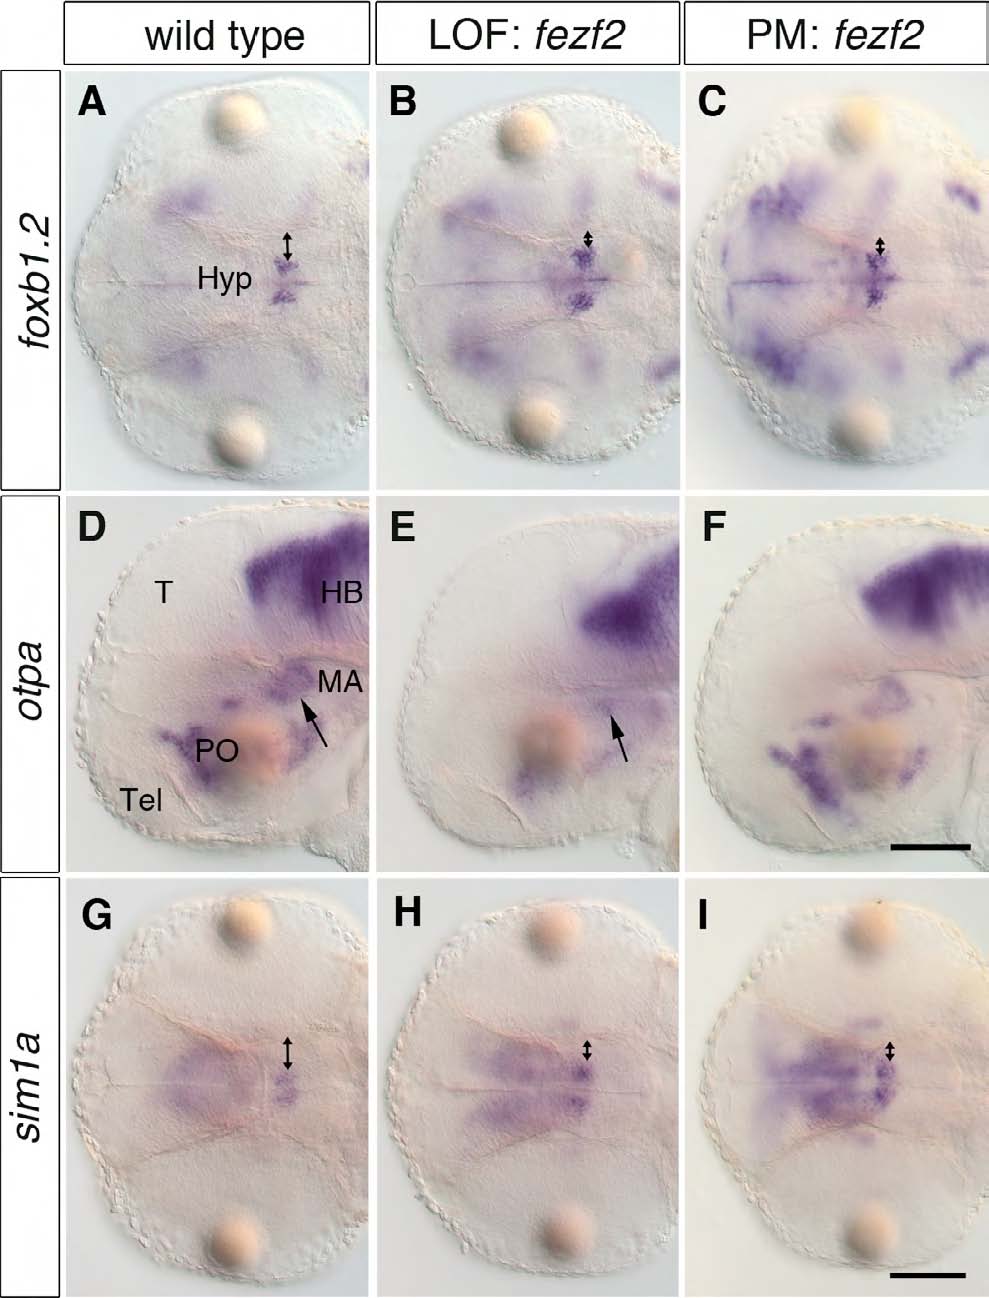
Fig. S16 Fezf2 activity from 1 dpf onwards regulates foxb1.2 and sim1a expression in the MA. WISH of 2-dpf wild-type (A,D,G) embryos injected with 4 ng fezf2 MO (B,E,H) and embryos injected with 4 ng caged fezf2 MO and uncaged at 1 dpf (C,F,I) to detect the expression of foxb1.2, otpa and sim1a. Dorsal views (A-C,G-I) and lateral views (D-F) are shown. (A-C) Both fezf2 morphants (B; n=32/32) and uncaged fezf2 PM at 1 dpf (C; n=16/20) show an expanded foxb1.2 expression domain (double-headed arrows). (D-F) Whereas the loss of Fezf2 activity early on results in a severe reduction of otpa in the MA (E, arrow; n=11/14), reduced Fezf2 activity from 1 dpf onward leads to no apparent changes in otpa expression (F; n=18/18). (G-I) The expression of sim1a is expanded in fezf2 morphants (H, double-headed arrows; n=19/19) as well as in uncaged fezf2 PM embryos (I, double-headed arrows; n=16/26). Doubleheaded arrows indicate the extent of the expression domains relative to the eye. T, tectum; Tel, telencephalon; Hyp, hypothalamus; LOF, loss-of-function; PO, preoptic area; HB, hindbrain; MA, mammillary area. Scale bar: 100 μm.