
Fig. 1
- ID
- ZDB-IMAGE-130423-33
- Genes
- Antibodies
- Publication
- Tay et al., 2013 - Lethal giant larvae 2 regulates development of the ciliated organ Kupffer's vesicle
- All Figures
- Figures for Tay et al., 2013
|
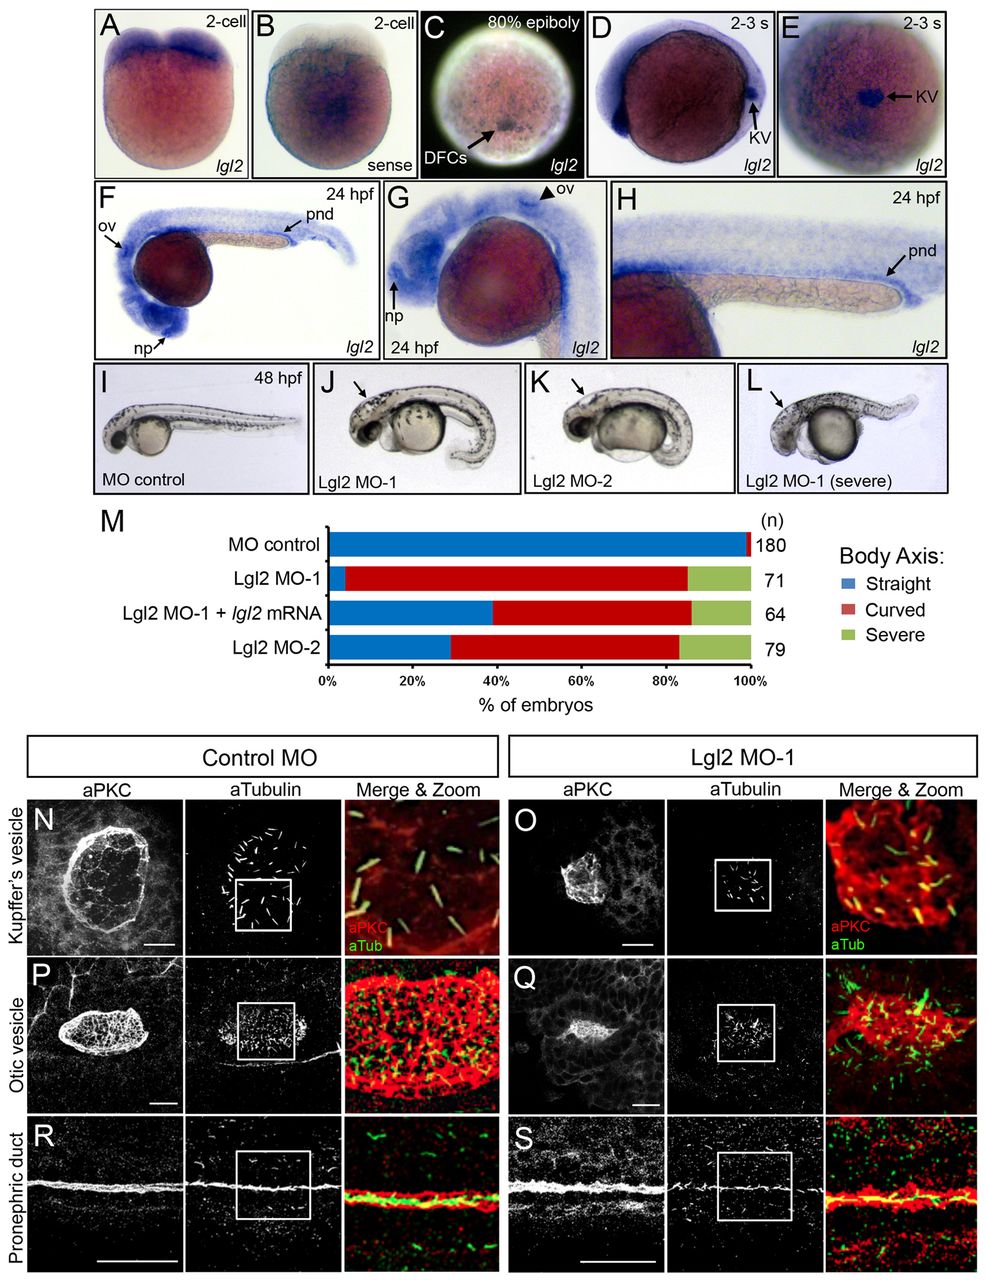
Fig. 1 Lgl2 controls development of ciliated organs. (A-H) Whole-mount RNA in situ hybridizations. At the 2-cell stage, antisense lgl2 probes show that lgl2 mRNA is maternally supplied (A). Control lgl2 sense probes showed little background staining (B). lgl2 expression localized in the enveloping layer and dorsal forerunner cells (DFCs) at the 80% epiboly stage (C) and was prominently expressed in Kupffer’s vesicle (KV) at the 2-3 somite(s) stages (D,E). At 24 hpf, lgl2 is highly expressed in the ciliated nasal placodes (np), otic vesicles (ov) and pronephric ducts (pnd) (arrows in F). G and H show higher magnification images of lgl2 expression in the nasal placode and otic vesicle (G) and pronephric duct (H). (I-L) Embryo morphology at 2 dpf. Control embryos (I) had a straight body, whereas Lgl2 MO-1 (J) and Lgl2 MO-2 (K) embryos often showed a curved body. Lgl2 MO embryos also developed hydrocephalus (arrows in J-L) and in some cases had additional severe axial defects (L). (M) Percentage of embryos with body axis defects. n, number of embryos analyzed. (N-S) Fluorescence immunostaining using aPKC antibodies (red) to mark apical membranes of epithelial cells and acetylated tubulin antibodies (green) to label cilia revealed defects in the development of ciliated epithelia in KV (N,O), otic vesicles (P,Q) and pronephric ducts (R,S) in Lgl2 MO embryos (O,Q,S) relative to controls (N,P,R). White boxes indicate areas enlarged in ‘Merge & Zoom’ panels. Scale bars: 20 μm.