
IMAGE
Fig. 4
- ID
- ZDB-IMAGE-130416-23
- Publication
- Rahn et al., 2013 - Opa1 is required for proper mitochondrial metabolism in early development
- All Figures
- Figures for Rahn et al., 2013
Image
|
Figure Caption
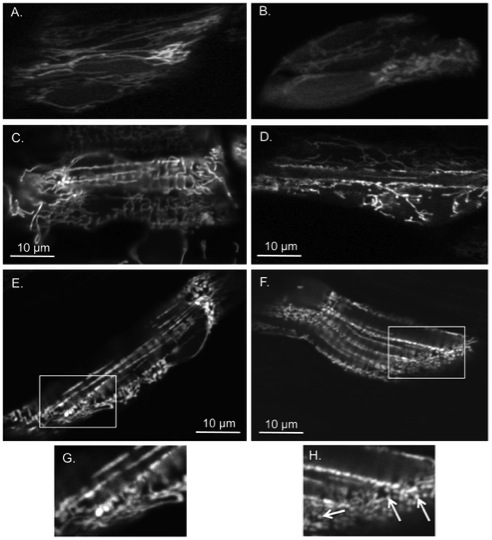
Fig. 4 Opa1 morphants have more fragmented mitochondria and disorganized fibers when compared to MMC morphants.Cells from MMC morphants at 24 hpf (A), 48 hpf (C), 72 hpf (E) are compared to similar regions in Opa1 morphants at 24 hpf (B), 48 hpf (D), 72 hpf (F). (A-B) obtained with multiphoton confocal microscopy 400x with 3.8-4.0x zoom and (C-F) with single photon confocal microscopy 400x with 4.0x zoom. (A-B) cells within the eye, (C-F) skeletal myocytes. (G) and (H) are enlargements of boxed areas in (E) and (F) respectively. Note abnormal mitochondrial morphology in (H) as denoted by arrows.
Figure Data
Acknowledgments
This image is the copyrighted work of the attributed author or publisher, and
ZFIN has permission only to display this image to its users.
Additional permissions should be obtained from the applicable author or publisher of the image.
Full text @ PLoS One