
Fig. 3
- ID
- ZDB-IMAGE-130411-12
- Publication
- Boglev et al., 2013 - Autophagy induction is a tor- and tp53-independent cell survival response in a zebrafish model of disrupted ribosome biogenesis
- All Figures
- Figures for Boglev et al., 2013
|
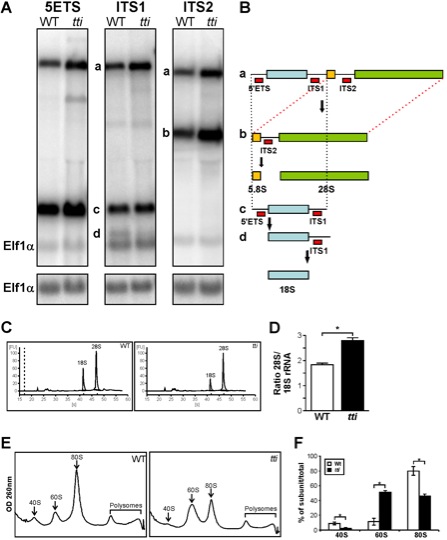
Fig. 3 (A) Northern analysis of RNA isolated from WT and ttis450 larvae at 120 hpf using 5′ETS, ITS1, and ITS2 probes to detect precursor forms of rRNA. Elf1α is a loading control. a-d correspond to the rRNA intermediates depicted in Figure 3B. (B) Schematic diagram showing the rRNA processing pathway in zebrafish [60]. The sites of hybridization of the 5′ETS, ITS1 and ITS2 probes are indicated. (C) Representative E-Bioanalyser analysis of total RNA isolated from WT and ttis450 larvae at 120 hpf demonstrates a reduction in the 18S peak in ttis450 larvae resulting in an elevated 28S/18S rRNA ratio in ttis450 (D). Graphical representation of the experiment shown in C. Data are represented as mean +/ SD (n = 5). (E) Representative polysome fractionation analysis performed on WT and ttis450 larvae at 96 hpf demonstrates reduced levels of 40S ribosomal subunits and 80S monosomes and an increase in free 60S subunits in ttis450 larvae compared to WT. (F) Graphical representation of the experiment shown in E. Data are represented as mean +/ SD (n = 5) *p<0.05.