
Image
|
Figure Caption
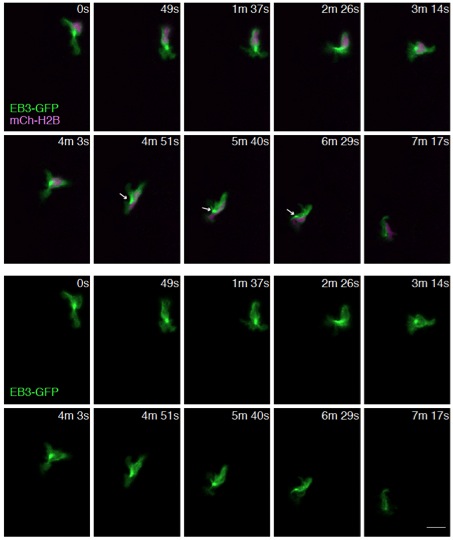
Fig. S1 The MTOC is mainly localized in front of the nucleus and occasionally on the side of the nucleus. Time-lapse imaging of a neutrophil expressing EB3-GFP and a nucleus probe mCherry-histone H2B. Arrows indicate localization of MTOC on the side of the nucleus. Scale bar: 10 μm.
Acknowledgments
This image is the copyrighted work of the attributed author or publisher, and
ZFIN has permission only to display this image to its users.
Additional permissions should be obtained from the applicable author or publisher of the image.
Full text @ J. Cell Sci.