
Image
|
Figure Caption
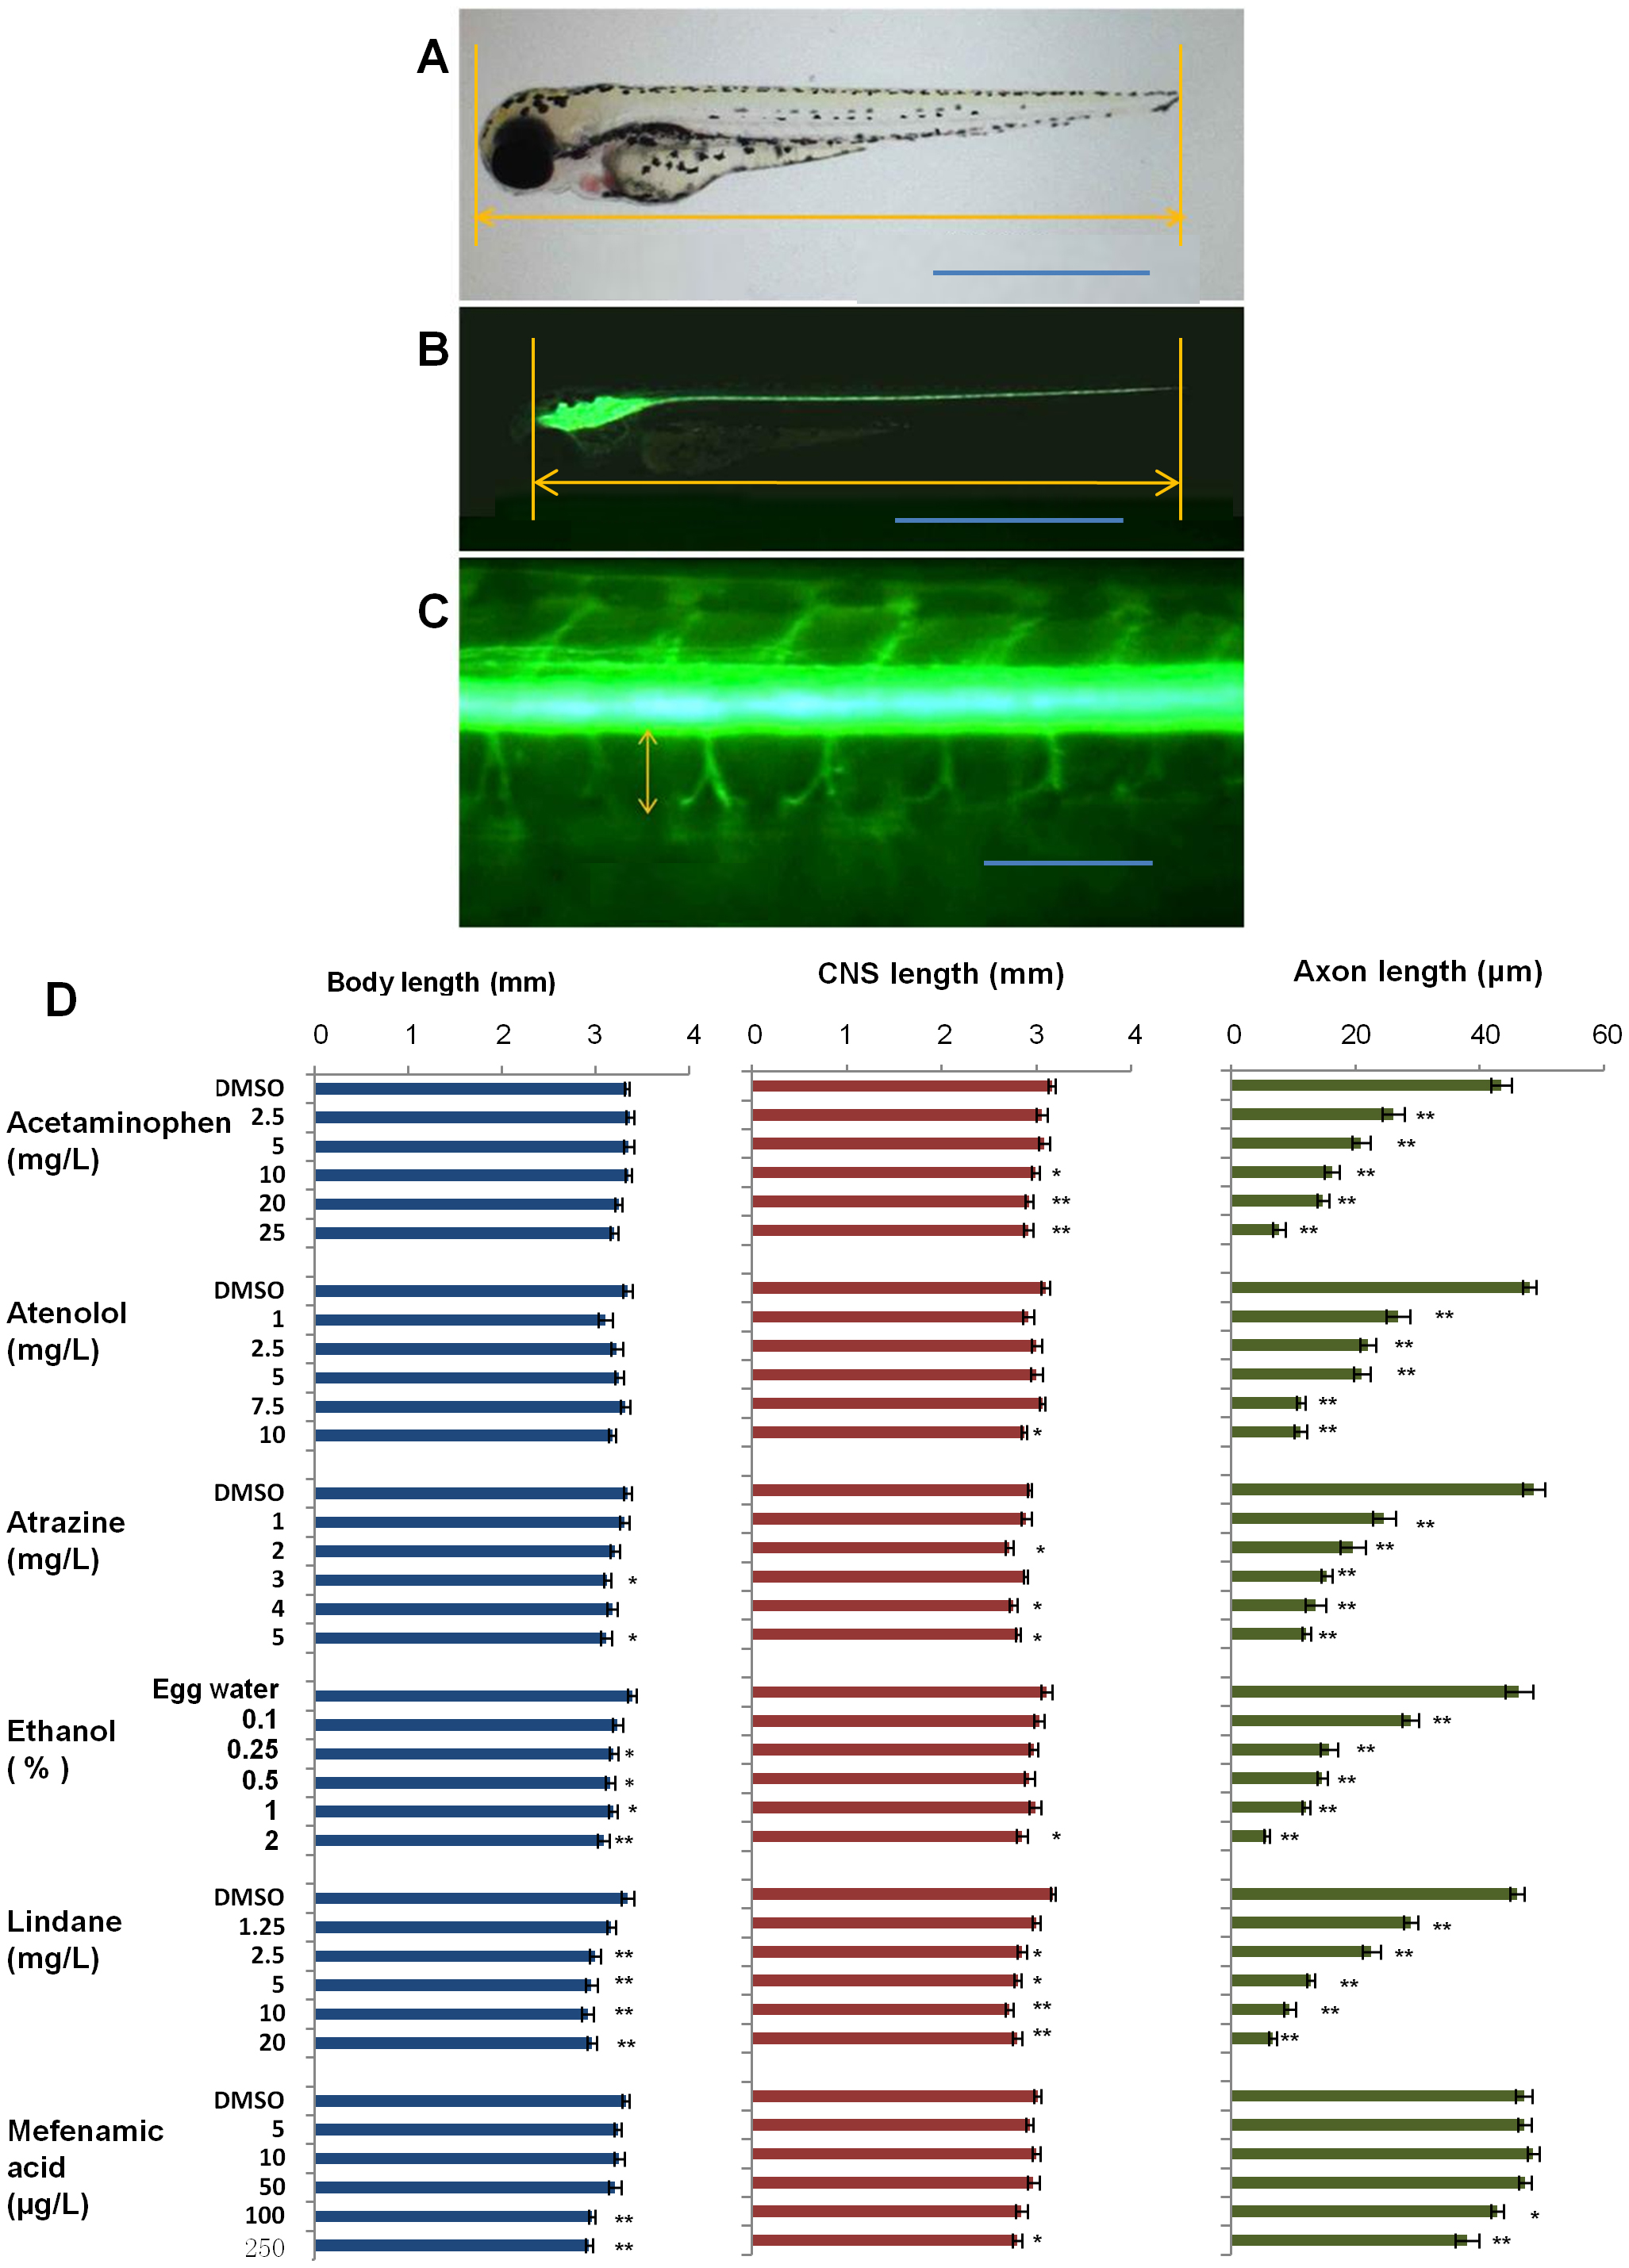
Fig. 5 Body length, CNS length and axon length of Tg(nkx2.2a:mEGFP) fry in the presence of variable chemicals.