
Fig. 2
- ID
- ZDB-IMAGE-130320-15
- Genes
- Publication
- Choi et al., 2013 - In vivo monitoring of cardiomyocyte proliferation to identify chemical modifiers of heart regeneration
- All Figures
- Figures for Choi et al., 2013
|
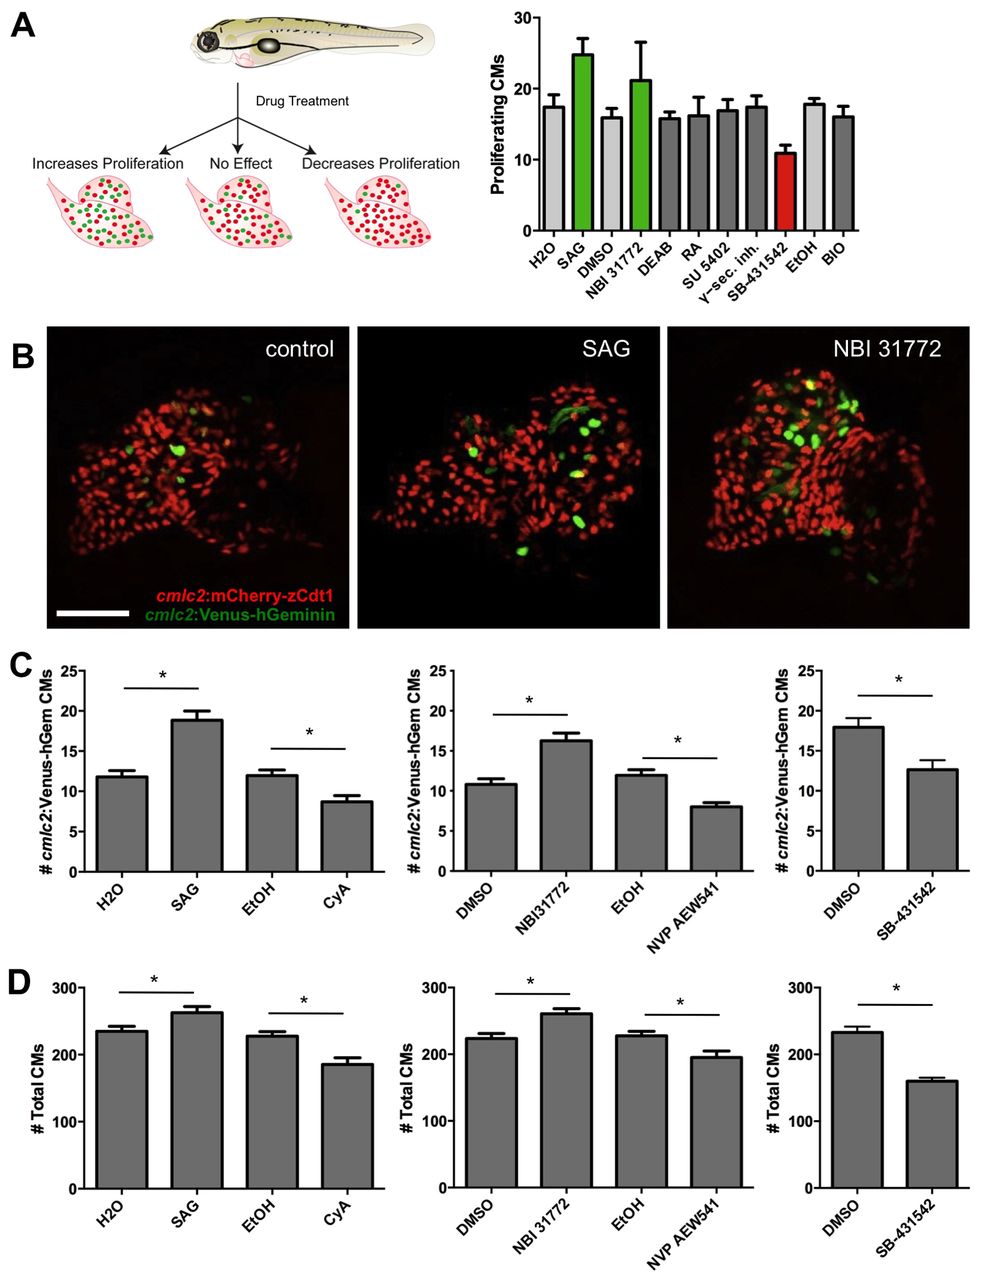
Fig. 2 Hedgehog and Igf signaling promote embryonic cardiomyocyte proliferation in zebrafish. (A) Small molecule screen to identify signaling pathways that affect cardiomyocyte (CM) proliferation between 3 and 4 dpf. Green bars, drugs that were identified as potential enhancers of proliferation; red bars, drug that was identified as a potential inhibitor. Data are represented as mean±s.e.m. n=8-12 embryos per condition. In the schematic, green and red circles represent proliferating and non-proliferating cells, respectively. (B) Representative maximum intensity projections of 4 dpf cmlc2:FUCCI embryos treated with Smoothened agonist (SAG) or the Igf agonist NBI-31772. Scale bars: 50 μm. Anterior is to the left in images. (C) Effects of treatments with SAG (5 μM), CyA (5 μM), NBI-31772 (2.5 μM), NVP AEW541 (5 μM) and SB-431542 (5 μM) on cardiomyocyte proliferation signals. n=30-48, mean±s.e.m. *P<0.005, Student′s t-test. Experiments for an individual graph were performed on a combined pool of embryos. Proliferation indices could vary between pools used for each individual graph. (D) Changes in proliferation were reflected by analogous changes in the total number of cardiomyocytes in cmlc2:nucDsRed2 embryos at 4 dpf. n=23-35, mean±s.e.m. *P<0.05, Student′s t-test.