
IMAGE
Fig. S3
- ID
- ZDB-IMAGE-130306-7
- Publication
- So et al., 2013 - Wnt/beta-catenin signaling cell-autonomously converts non-hepatic endodermal cells to a liver fate
- All Figures
- Figures for So et al., 2013
Image
|
Figure Caption
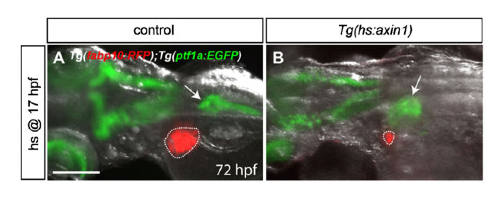
Fig. S3 Axin1 overexpression greatly reduces liver size. ( A , B ) The Tg(fabp10:RFP) and Tg(ptf1a:EGFP) lines were used to reveal hepatocytes (red) and ventral pancreatic cells (green), respectively. Control and Tg(hs:axin1) embryos were heat-shocked at 17 hpf and harvested at 72 hpf. Liver size was greatly reduced in Axin1-overexpressing embryos compared to controls (B versus A, dotted lines). Arrows point to the pancreas. Dorsal views, anterior to the left. Scale bar, 200 u m.
Acknowledgments
This image is the copyrighted work of the attributed author or publisher, and
ZFIN has permission only to display this image to its users.
Additional permissions should be obtained from the applicable author or publisher of the image.
Full text @ Biol. Open