
Image
|
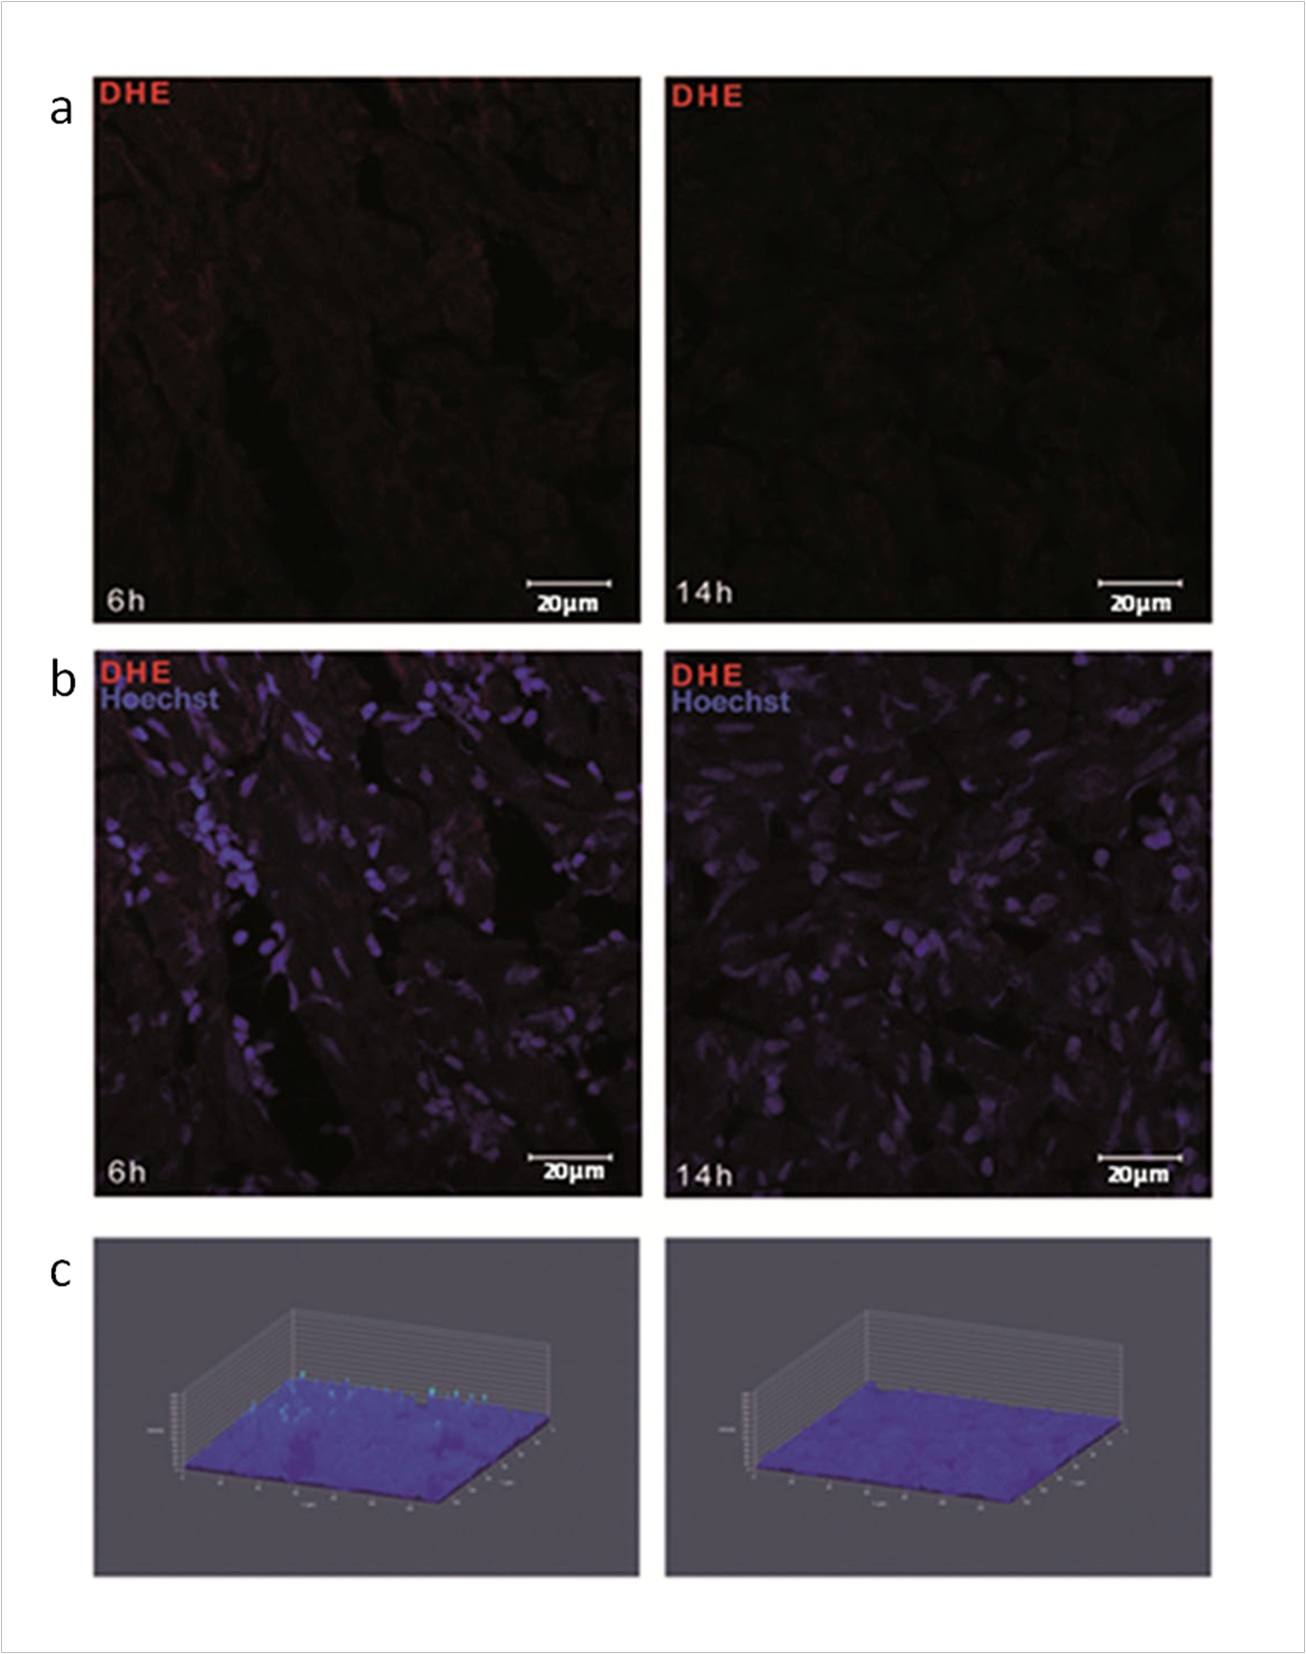
Figure Caption
Fig. s1 Oxidative stress detection by DHE fluorescence after H/R in vivo.(a) Representative confocal microscopy images of DHE staining at 6 and 14 h after H/R. (b) Merge of DHE and Hoechst nuclear staining. Calibration bar = 20 µm. White arrow-heads indicate DHE+ nuclei. (c) 3D representation of DHE fluorescence intensity distribution in the analyzed area: the z-axis shows the fluorescence intensity in cardiac nuclei, the y-axis and x-axis show the spatial distribution of nuclei on a plane.
Acknowledgments
This image is the copyrighted work of the attributed author or publisher, and
ZFIN has permission only to display this image to its users.
Additional permissions should be obtained from the applicable author or publisher of the image.
Full text @ PLoS One