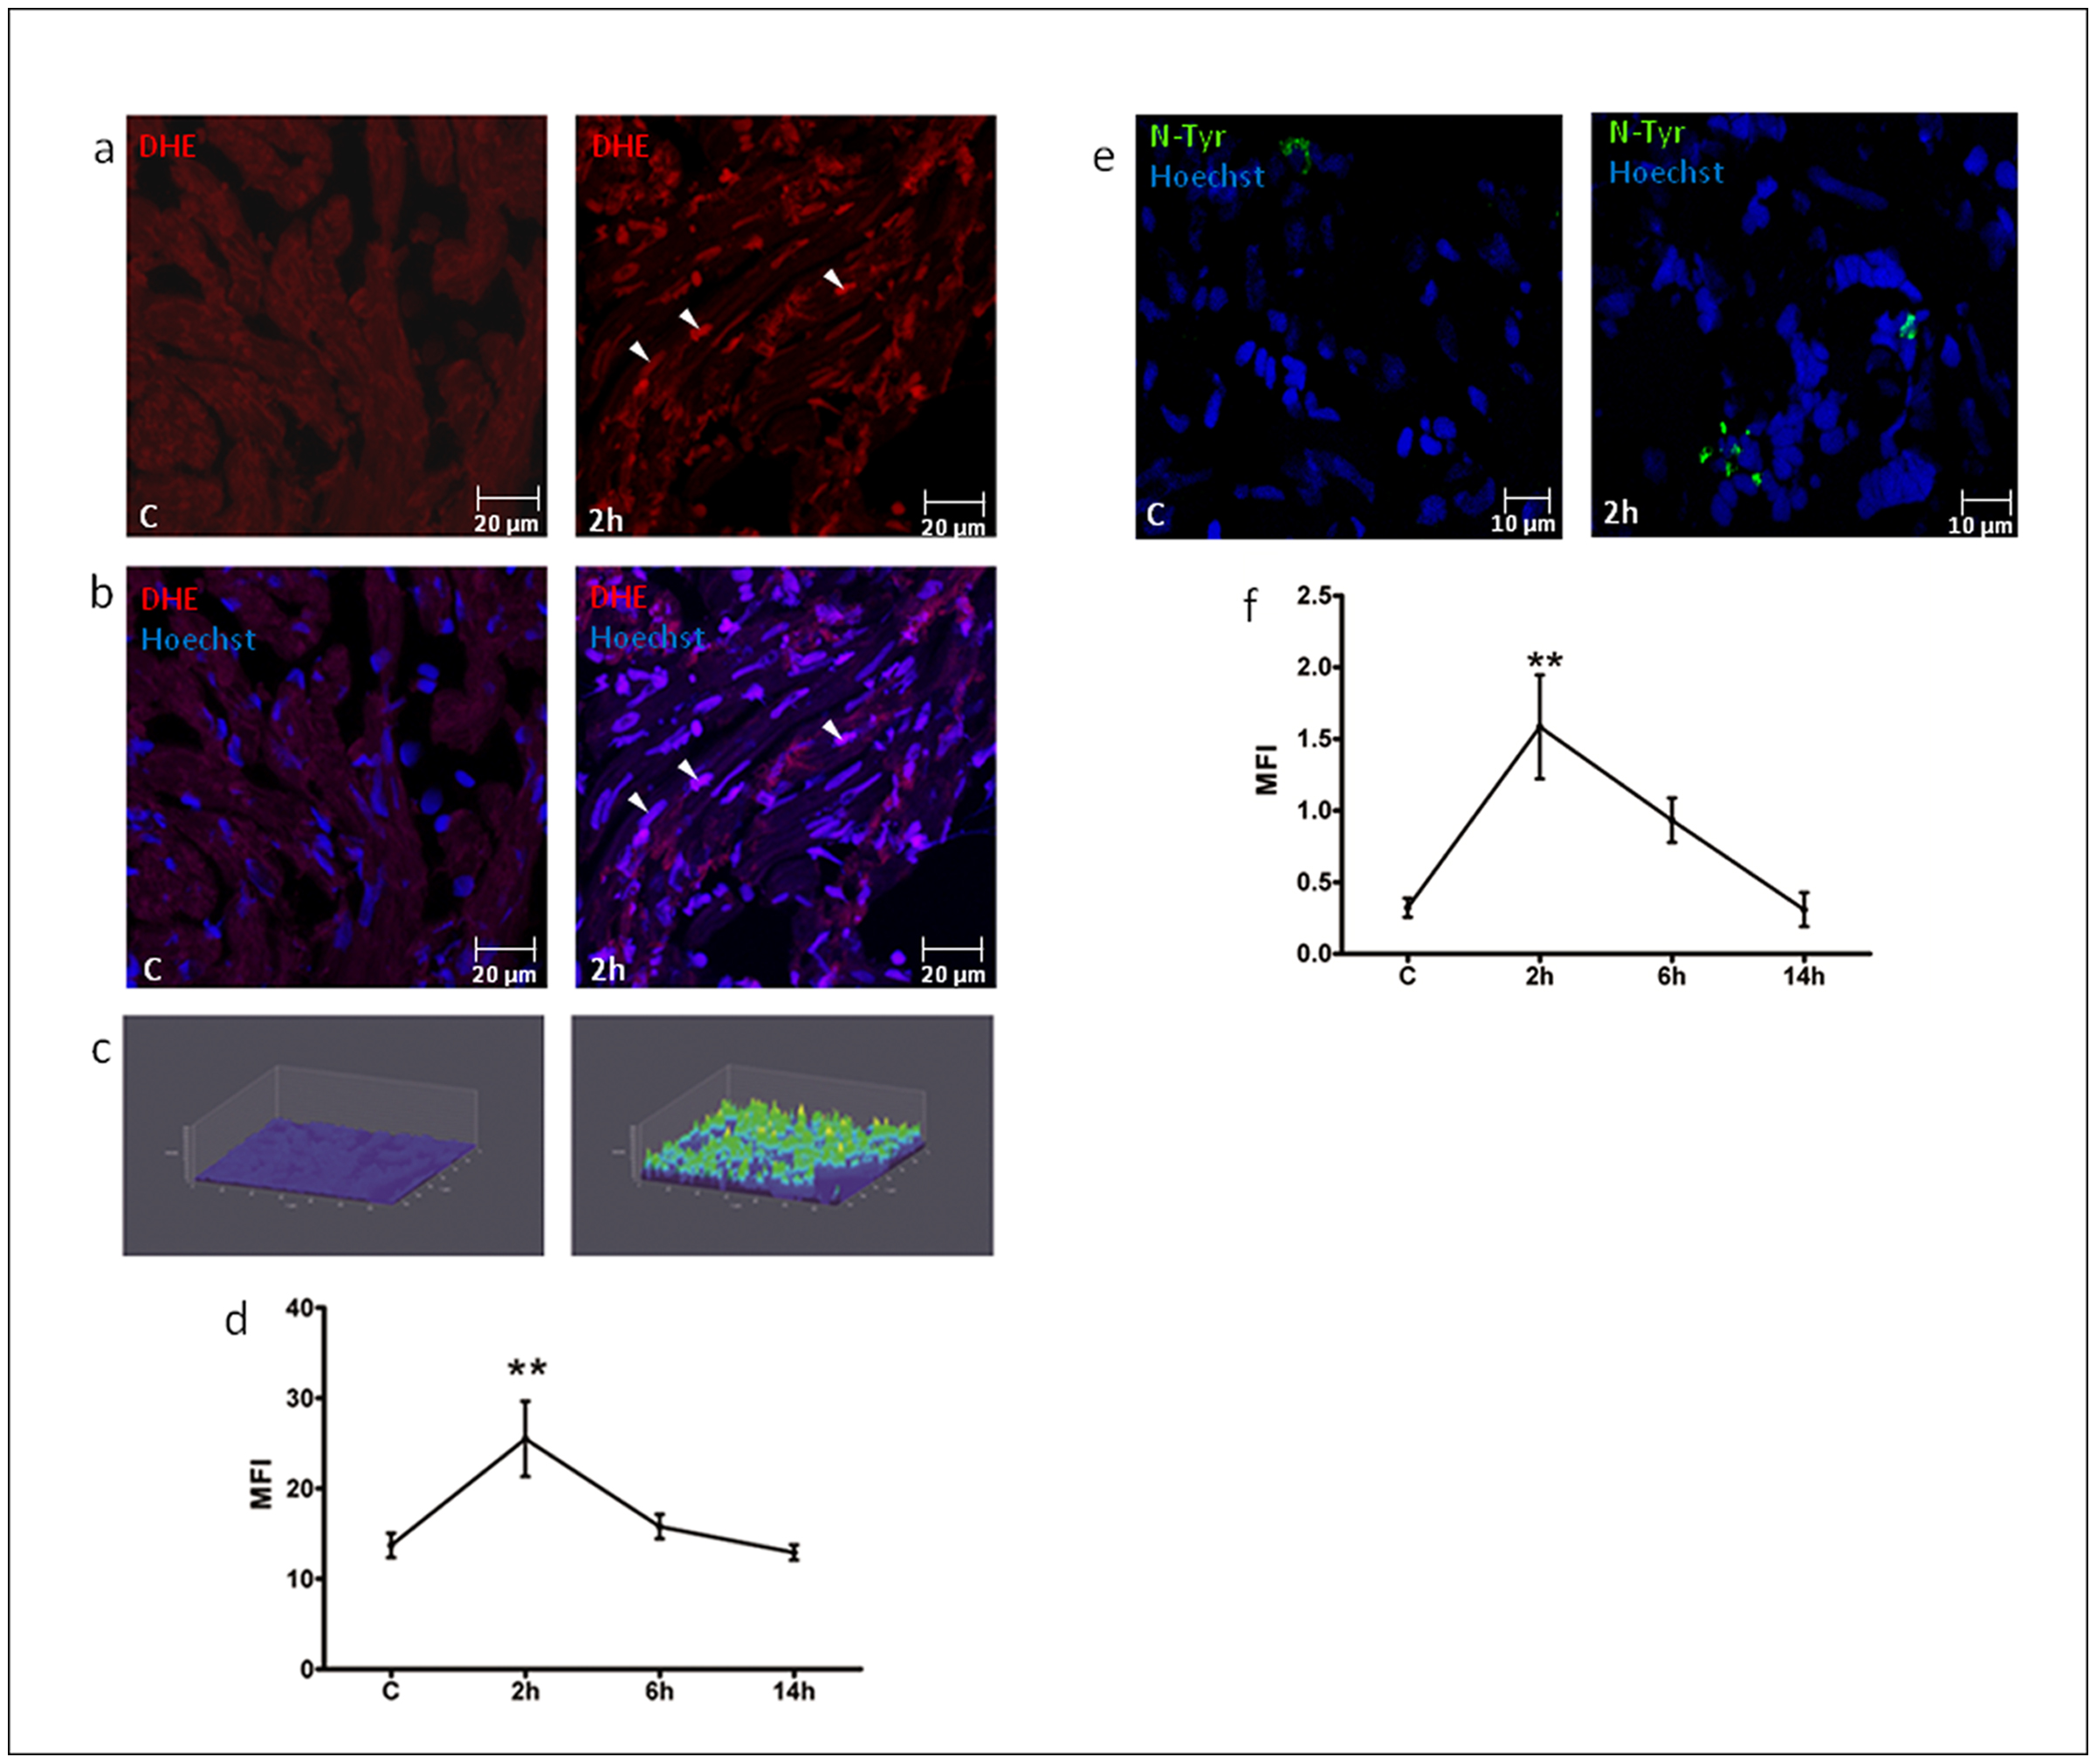
Fig. 1 Oxidative stress detection after H/R in vivo.
DHE staining (a-d) and N-Tyr immunofluorescence (e-f) of hearts under control conditions (C) and exposed to H/R. (a) Representative confocal microscopy images of DHE staining in C and 2 h after H/R. (b) Merge of DHE and Hoechst nuclear staining. Calibration bar = 20 µm. White arrow-heads indicate DHE+ nuclei. (c) 3D representation of DHE fluorescence intensity distribution in the analyzed area: the z-axis shows the fluorescence intensity in cardiac nuclei, the y-axis and x-axis show the spatial distribution of nuclei on a plane. (d) Graph shows Mean Fluorescence Intensity (MFI) in C and 2 h to 14 h after H/R (n = 4 at each time point; ** p<0.01 vs. C). Time course analysis revealed a peak of oxidative stress at 2 h in zebrafish adult heart sections, detected by DHE staining. (e) Representative confocal microscopy images of N-Tyr immunofluorescence, where green fluorescence indicates anti-N-Tyr and Hoechst nuclei staining: control (C, left panel) and 2 h after H/R (right panel). Calibration bar = 10µm. (f) Graph shows Mean Fluorescence Intensity (MFI) in C and 2 h to 14 h after H/R (n = 4 at each time point; ** p<0.01 vs. C). H/R induced protein nitrosylation with a peak effect at the 2 h time point.

