
IMAGE
Fig. 5
- ID
- ZDB-IMAGE-130225-17
- Publication
- Feng et al., 2012 - The Stress-Response Gene redd1 Regulates Dorsoventral Patterning by Antagonizing Wnt/β-catenin Activity in Zebrafish
- All Figures
- Figures for Feng et al., 2012
Image
|
Figure Caption
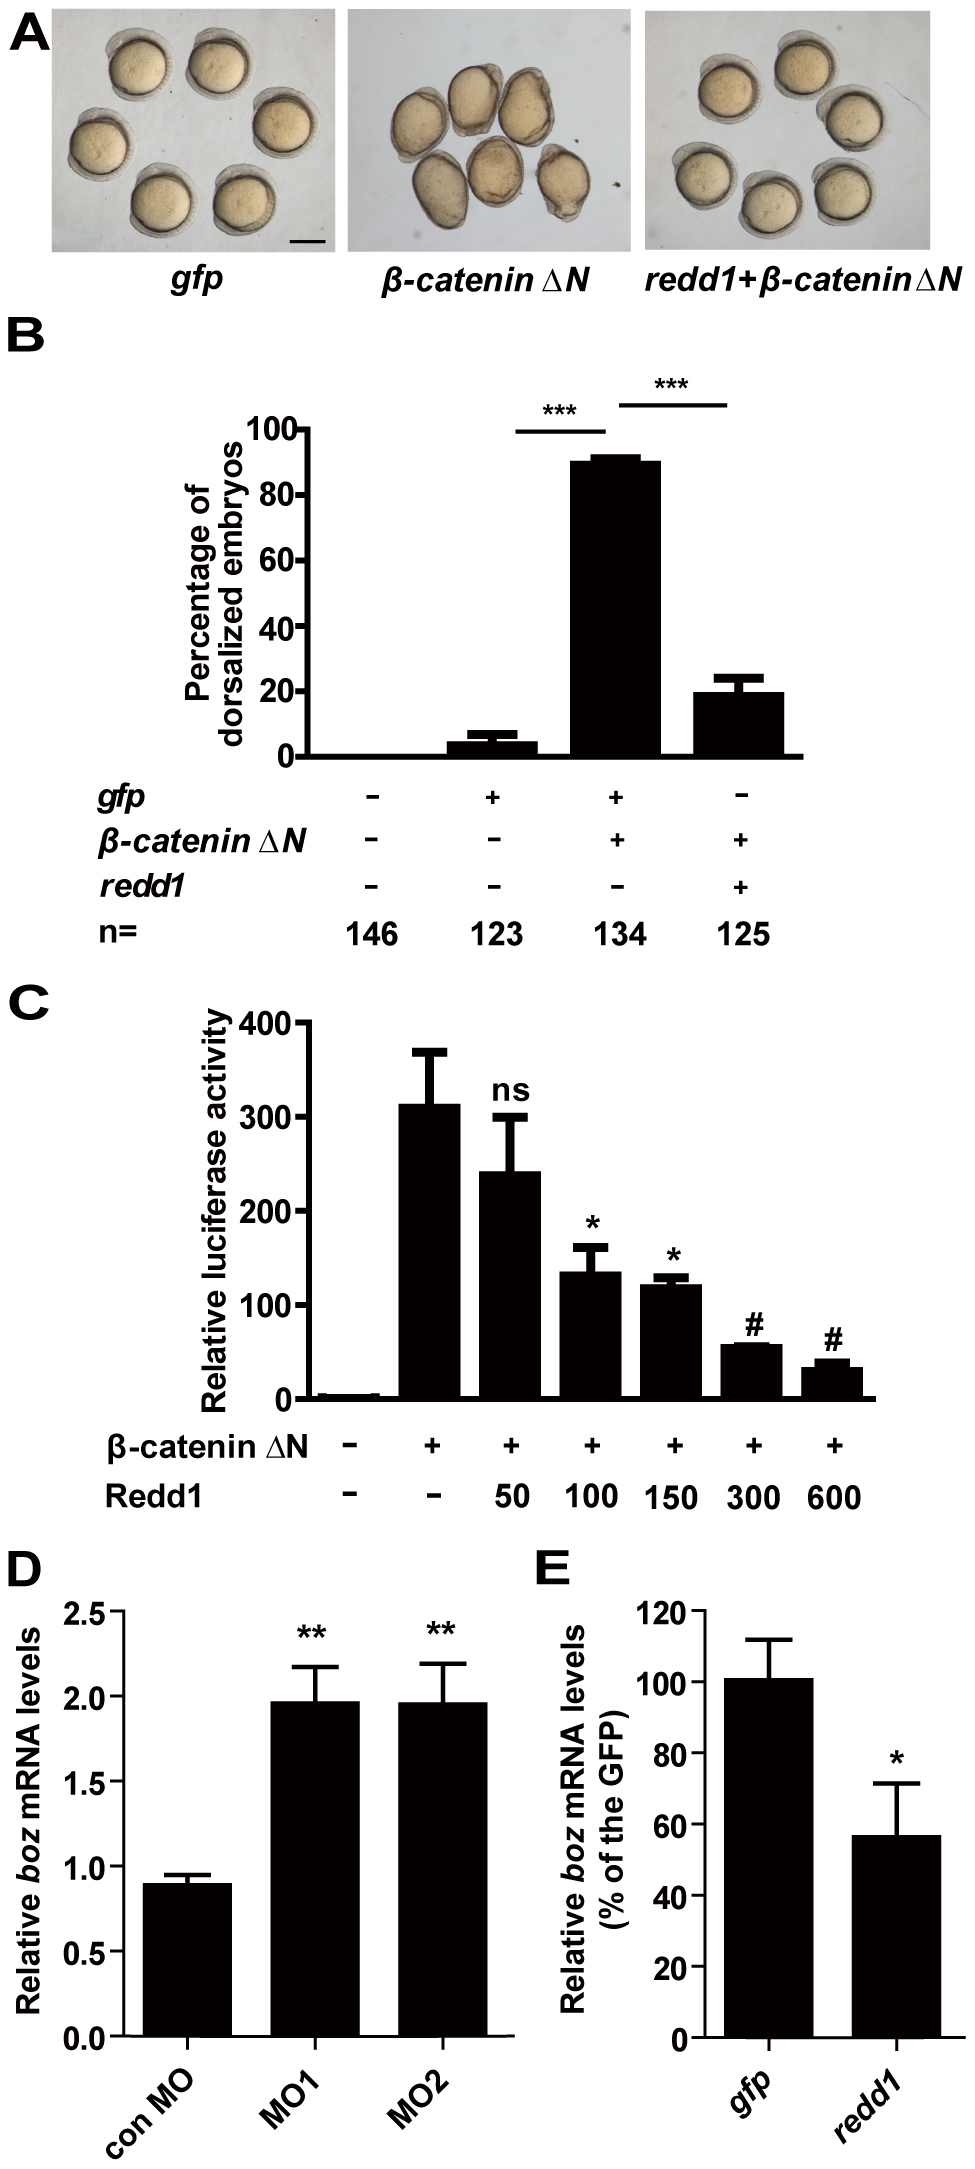
Fig. 5 Redd1 inhibits β-catenin action.
A and B) Redd1 inhibits β-catenin action in vivo. Representative view of gfp mRNA-, β-catenin ”N mRNA-, and β-catenin ΔN mRNA + redd1 mRNA-injected embryos at 5 somite stage is shown in A). Scale bar = 200 µm. Quantitative results are shown in B). The results are from three independent experiments and the total embryo number is given at the bottom. *** P<0.001. C) Redd1 inhibits β-catenin activity in vitro. HEK293T cells were transfected with β-catenin ΔN plasmid DNA and increasing doses of Redd1 plasmid DNA, together with the same amount of TCF/LEF-luciferase reporter DNA. Cells transfected with TCF/LEF-luciferase reporter DNA alone were used as negative control ().Values are means ± S.E., n = 3. ns, not significant, * and #, P<0.05 and P<0.001 compared to the β-catenin ΔN group. D) Redd1 knockdown increases boz expression. Embryos were injected with control MO, redd1 targeting MO1 or MO2 at one-cell stage. The embryos were raised to the dome stage. The boz mRNA levels were measured by quantitative real-time RT-PCR. E) Forced expression of Redd1 decreases boz expression. Embryos were injected with gfp mRNA or redd1 mRNA at one-cell stage and were analyzed at dome stage. The boz mRNA levels were measured by quantitative real-time RT-PCR.
Acknowledgments
This image is the copyrighted work of the attributed author or publisher, and
ZFIN has permission only to display this image to its users.
Additional permissions should be obtained from the applicable author or publisher of the image.
Full text @ PLoS One