
Fig. 3
- ID
- ZDB-IMAGE-130225-15
- Publication
- Feng et al., 2012 - The Stress-Response Gene redd1 Regulates Dorsoventral Patterning by Antagonizing Wnt/β-catenin Activity in Zebrafish
- All Figures
- Figures for Feng et al., 2012
|
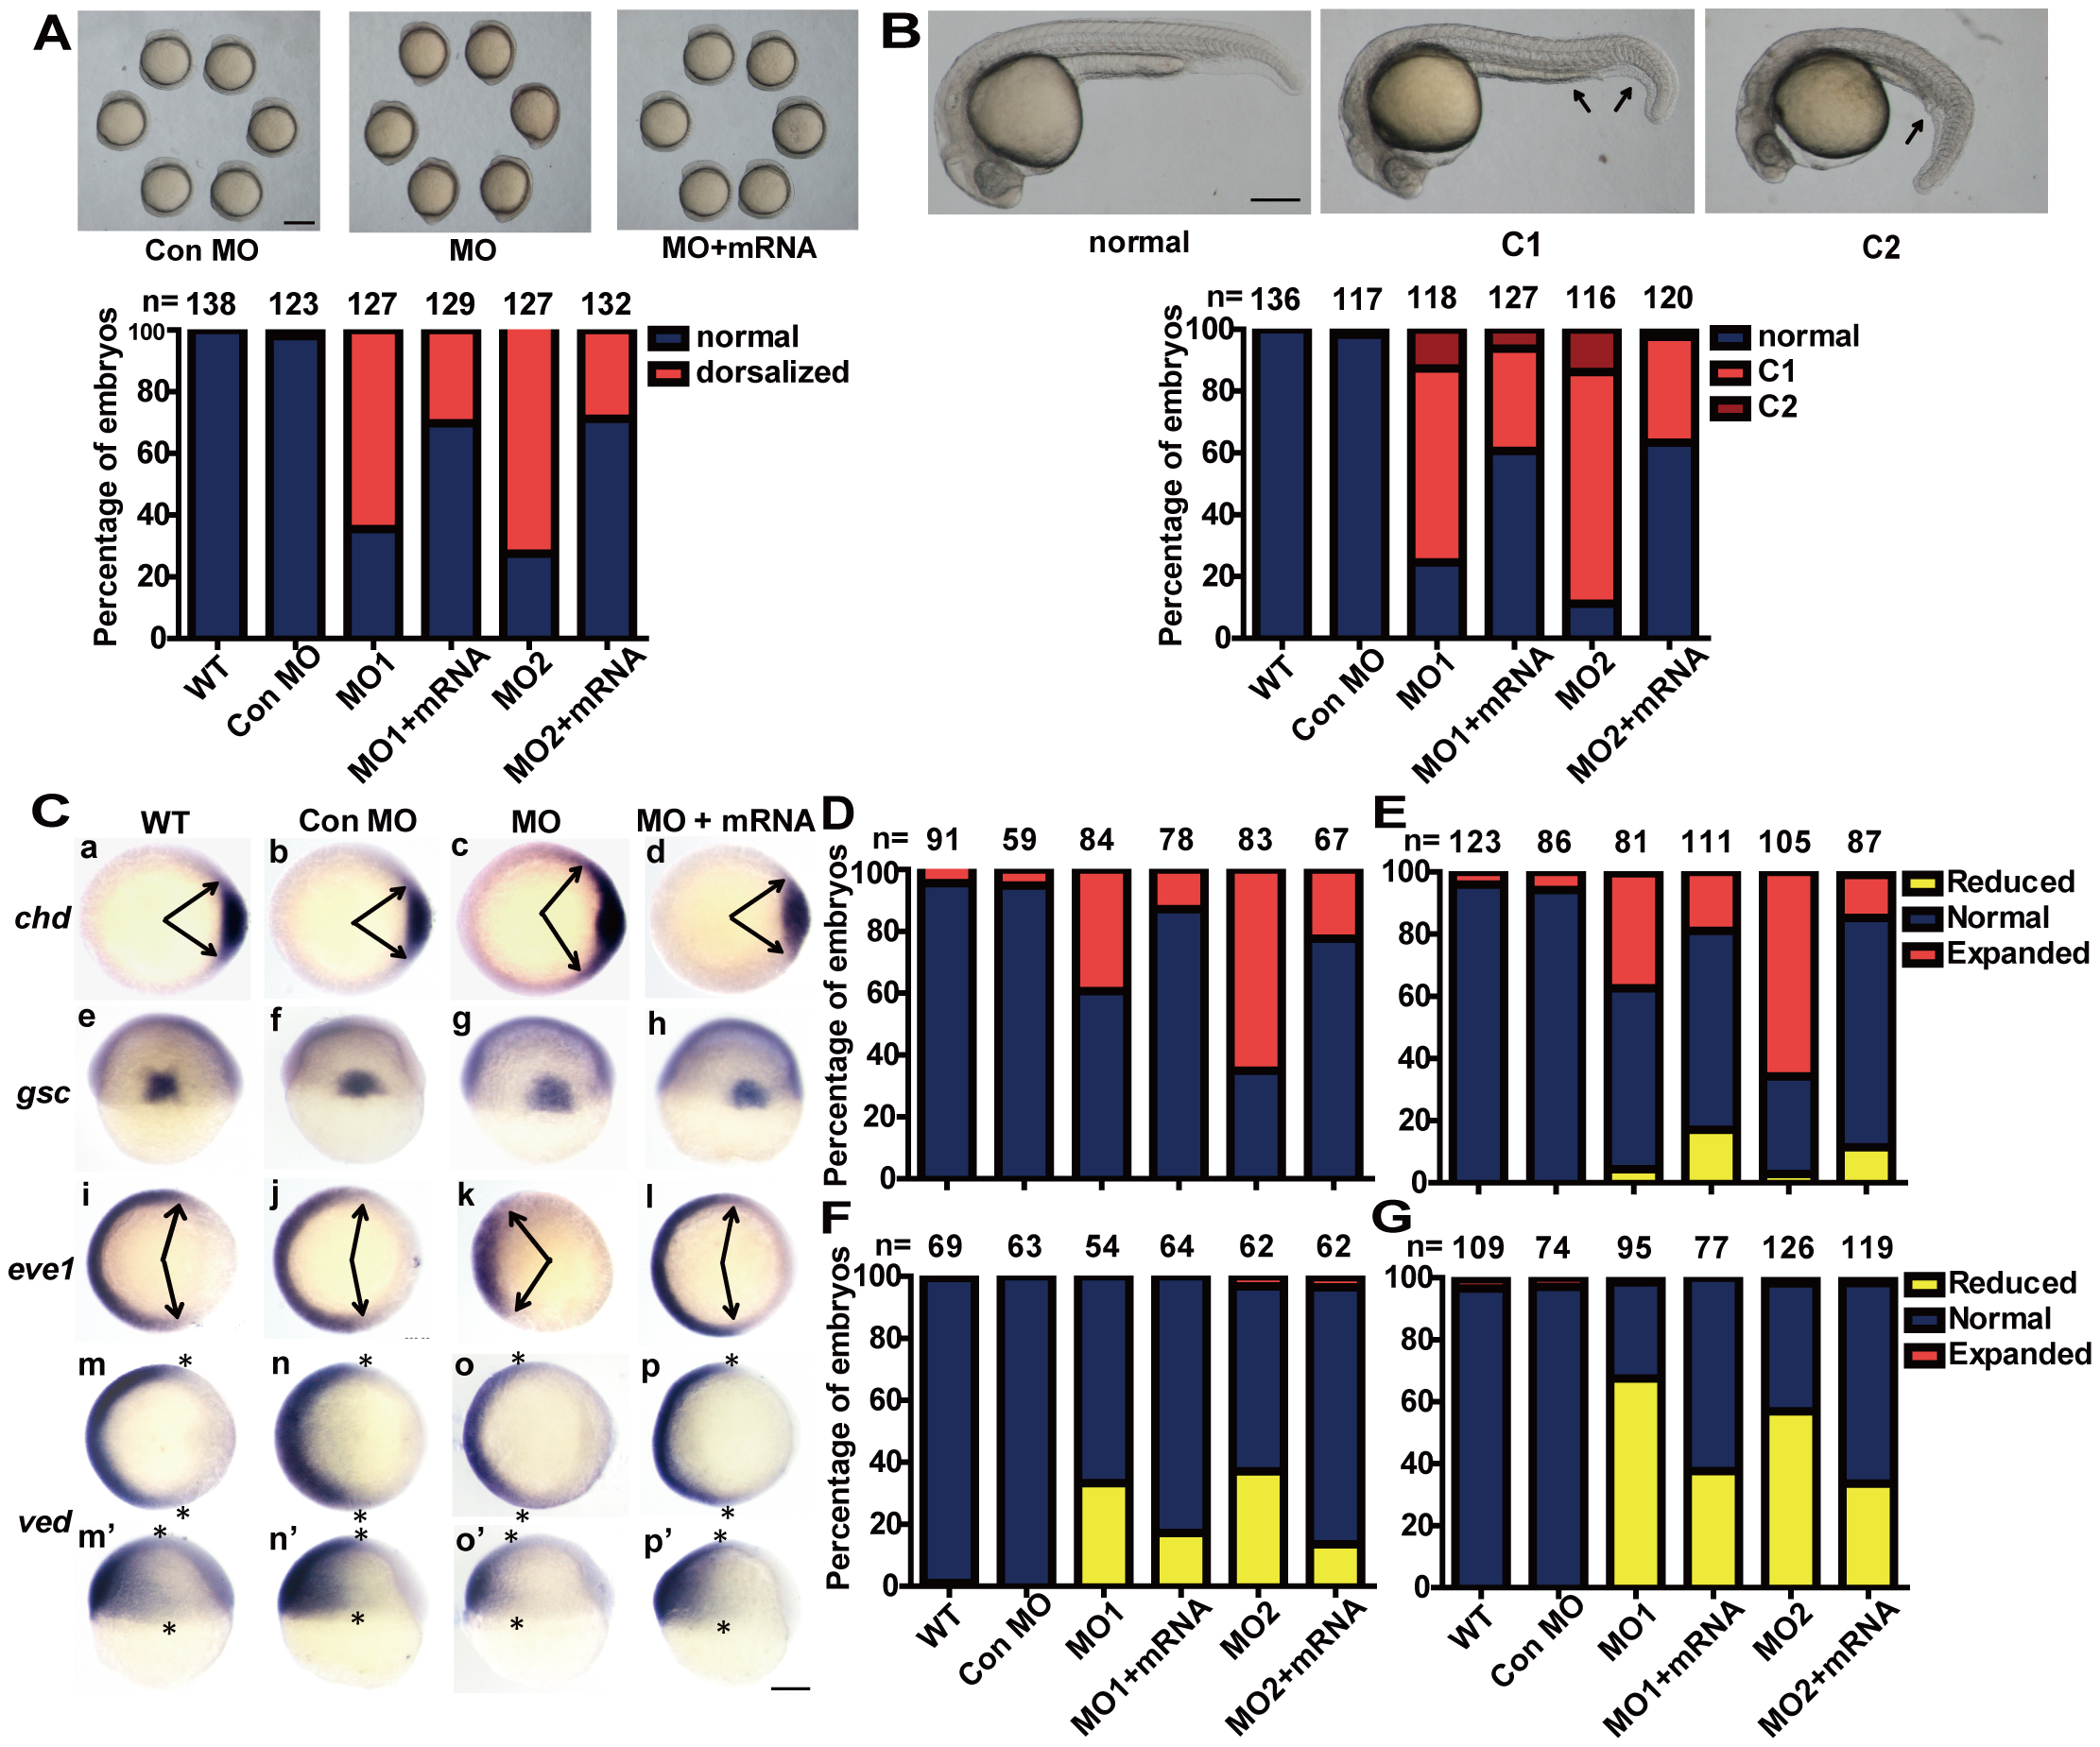
Fig. 3 Knockdown of redd1 results in dorsalized embryos.
A) Effects of redd1 knockdown. Upper panels are representative views of zebrafish embryos (at 5 somite stage) injected with control MO, redd1 targeting MO (MO1 or MO2), or redd1 targeting MO+ redd1 mRNA (MO+mRNA). Lateral views with anterior up. Scale bar = 200 µm. The results are from three independent experiments and the total embryo number is given at the top. B) Effects of redd1 knockdown. The experimental groups are the same as in A). Representative images of 24 hpf zebrafish embryos are shown in the upper panel. Scale bar = 200 µm. The percentage of dorsalized embryos in each group is shown in the lower panel. The total number of embryos is shown on the top of each column. C–G) Effects of redd1 knockdown on the expression of dorsoventral marker genes. Embryos described in A) and B) were analyzed by in situ hybridization using the indicated probes. Representative images are shown in C). Panels a–d and i–p are animal pole views with dorsal to the right; panels e–h are dorsal views with animal pole up; panels m2–p2 are lateral views with dorsal to the right and animal pole up. Arrows indicate the edges of the chd and eve1 mRNA expression domains. Asterisks indicate the edges of the ved mRNA expression domain. Scale bar = 200 µm. The percentage of embryos in each category is shown in D (chd), E (gsc), F (eve1), and G (ved). The results are from three independent experiments and the total embryo number is given at the top.