
Fig. S2
- ID
- ZDB-IMAGE-130218-13
- Publication
- Nikaido et al., 2013 - A Systematic Survey of Expression and Function of Zebrafish frizzled Genes
- All Figures
- Figures for Nikaido et al., 2013
|
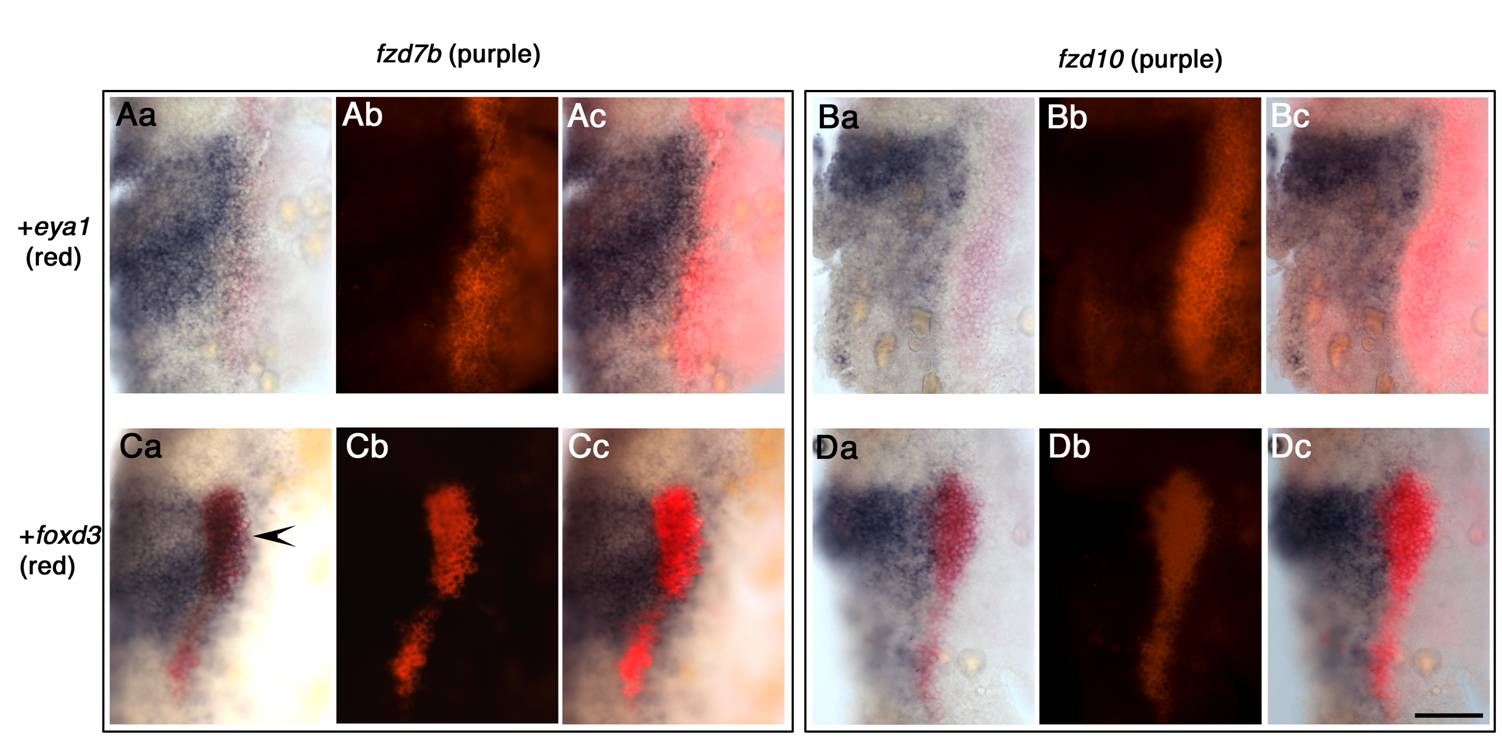
Fig. S2 fzd7b expression domain overlaps future NCC marked by foxd3 domain, whilst fzd10 expression domain does not. Here, eya1 is used as placodal marker, and foxd3 is used as NCC marker. Aa–Ac) Staining with fzd7b (purple) and eya1 (red). Ba–Bc) fzd10 (purple) and eya1 (red). Ca–Cc) fzd7b (purple) and foxd3 (red). Da–Dc) fzd10 (purple) and foxd3 (red). All images show dorsal views of right half of flat-mounted 1 -somite stage embryos. Anterior to the top. a, b, c for each data set represent bright field, dark field, and merged images, respectively. Note that there is a gap between fzd10 expression domain and eya1 expression domain (B), whilst fzd7b and eya1 expression domains contact each other directly (A), suggesting fzd7b expression domain expands more laterally than fzd10. In C, fzd7b and foxd3 are co-expressed (arrowhead). In contrast, fzd10 and foxd3 expression domains abut, but do not overlap (D). Scale bar: 100 μm.