
IMAGE
Fig. S5
- ID
- ZDB-IMAGE-130218-10
- Publication
- Nikaido et al., 2013 - A Systematic Survey of Expression and Function of Zebrafish frizzled Genes
- All Figures
- Figures for Nikaido et al., 2013
Image
|
Figure Caption
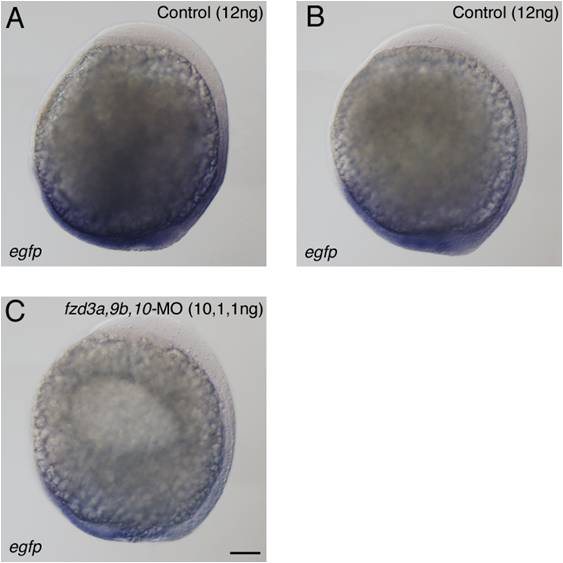
Fig. S5 gfp expression in TopdGFP transgenic fish embryos injected with fzd-MOs. A, B) Typical expression patterns of control embryos categorised as “strong” (A) and “weak” (B) group. C) Embryo co-injected with 10 ng of fzd3a-MO, 1 ng of fzd9b-MO and 1 ng of fzd10-MO. This embryo was categorized as “weak” expression. Left side view with anterior oriented to the top. Bud stage. See Table S2 for quantitation. Scale bar: 100 μm.
Acknowledgments
This image is the copyrighted work of the attributed author or publisher, and
ZFIN has permission only to display this image to its users.
Additional permissions should be obtained from the applicable author or publisher of the image.
Full text @ PLoS One