
IMAGE
Fig. S7
- ID
- ZDB-IMAGE-130110-21
- Publication
- Chiavacci et al., 2012 - MicroRNA 218 Mediates the Effects of Tbx5a Over-Expression on Zebrafish Heart Development
- All Figures
- Figures for Chiavacci et al., 2012
Image
|
Figure Caption
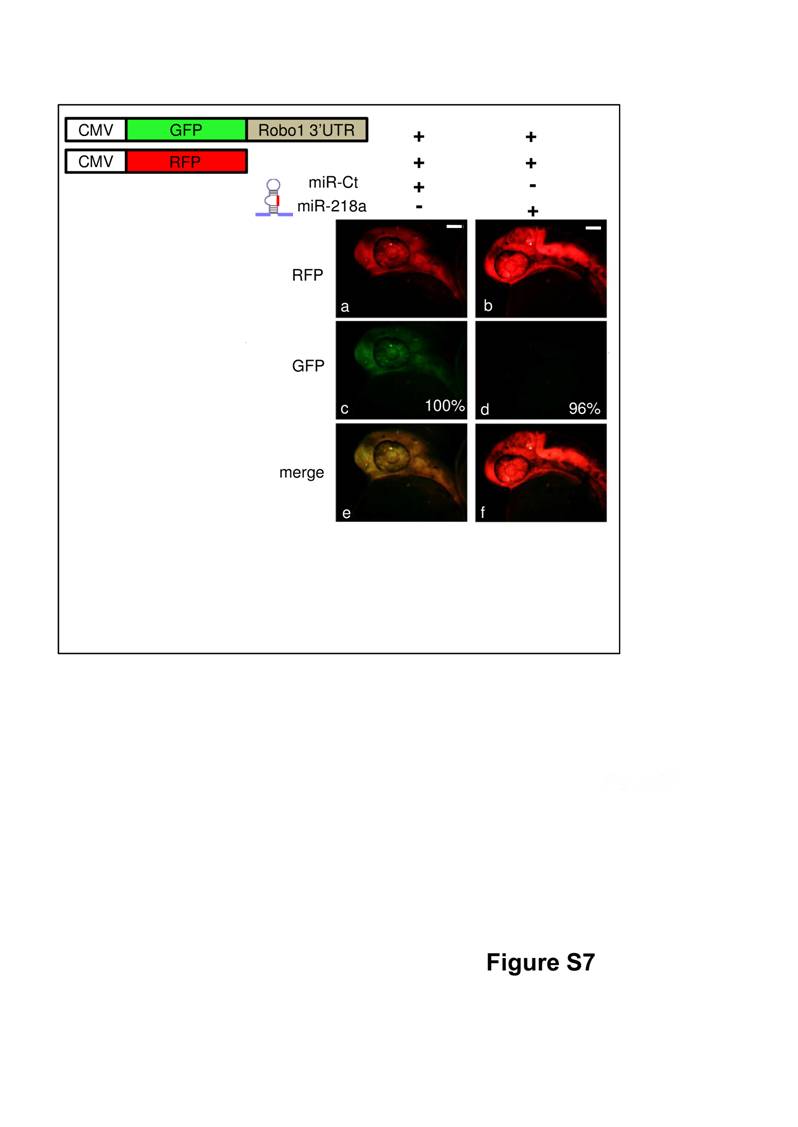
Fig. S7 miR-218 targets the 3′ UTR of robo1 in zebrafish embryos. Top: schematic representation of sensors and miRNAs used for in vivo sensor assay. Bottom: examples of 24 hpf embryos microinjected with 40 pg of RFP mRNA, 400 pg of 3′UTR robo 1 sensor and 160 pg of miR-Ct (a,c,e) or miR-218a (b,d,f). In figures C and D the percentage of the relative phenotypes were indicated. ~30 embryos for each thesis were injected. Scale bars 50 μm.
Acknowledgments
This image is the copyrighted work of the attributed author or publisher, and
ZFIN has permission only to display this image to its users.
Additional permissions should be obtained from the applicable author or publisher of the image.
Full text @ PLoS One