
IMAGE
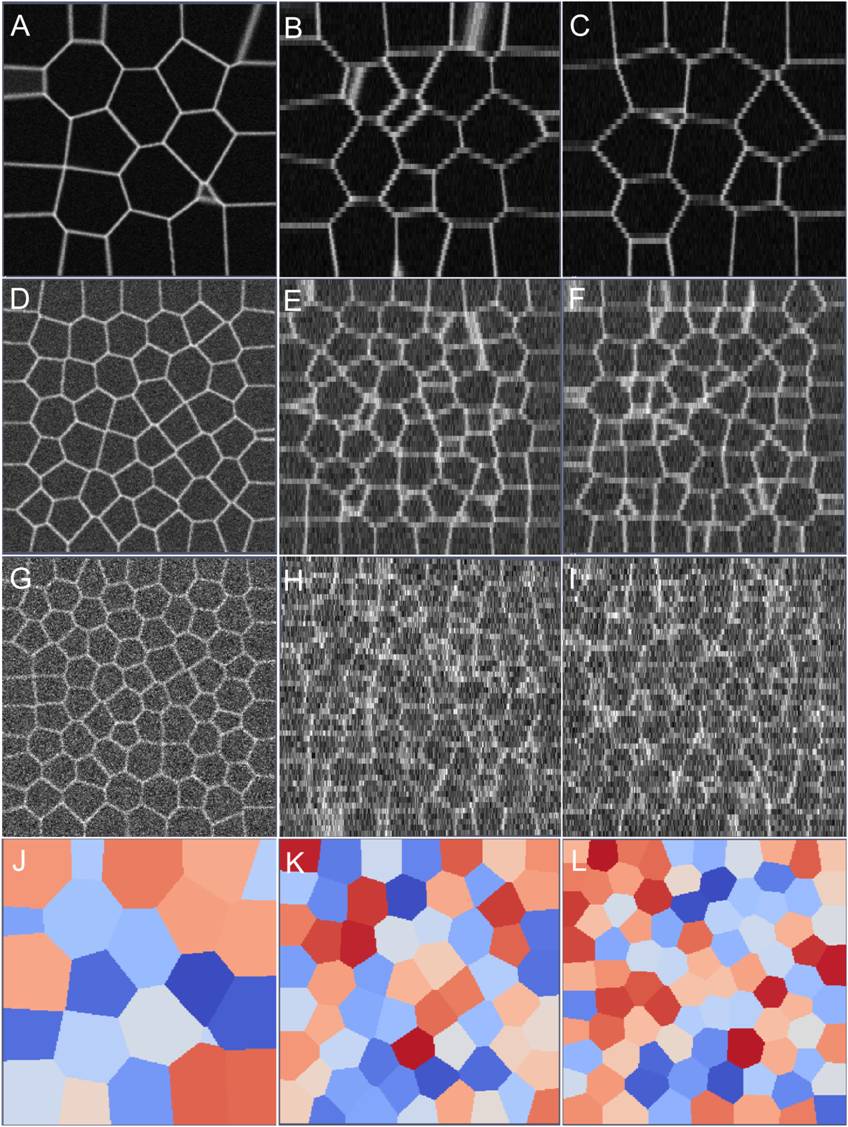
Fig. S3
- ID
- ZDB-IMAGE-130109-39
- Publication
- Mosaliganti et al., 2012 - ACME: Automated Cell Morphology Extractor for Comprehensive Reconstruction of Cell Membranes
- All Figures
- Figures for Mosaliganti et al., 2012
Image
|
Figure Caption
Fig. S3 Synthetic membrane images along XY, XZ, and YZ sections. The (σ, λ) values were sampled as (A-C) (0.01, 1.00), (D-F) (0.05, 0.6), and (G-I) (0.1, 0.1). Corresponding ground truth segmentation images (XY) are shown in (J-L).
Acknowledgments
This image is the copyrighted work of the attributed author or publisher, and
ZFIN has permission only to display this image to its users.
Additional permissions should be obtained from the applicable author or publisher of the image.
Full text @ PLoS Comput. Biol.