
|
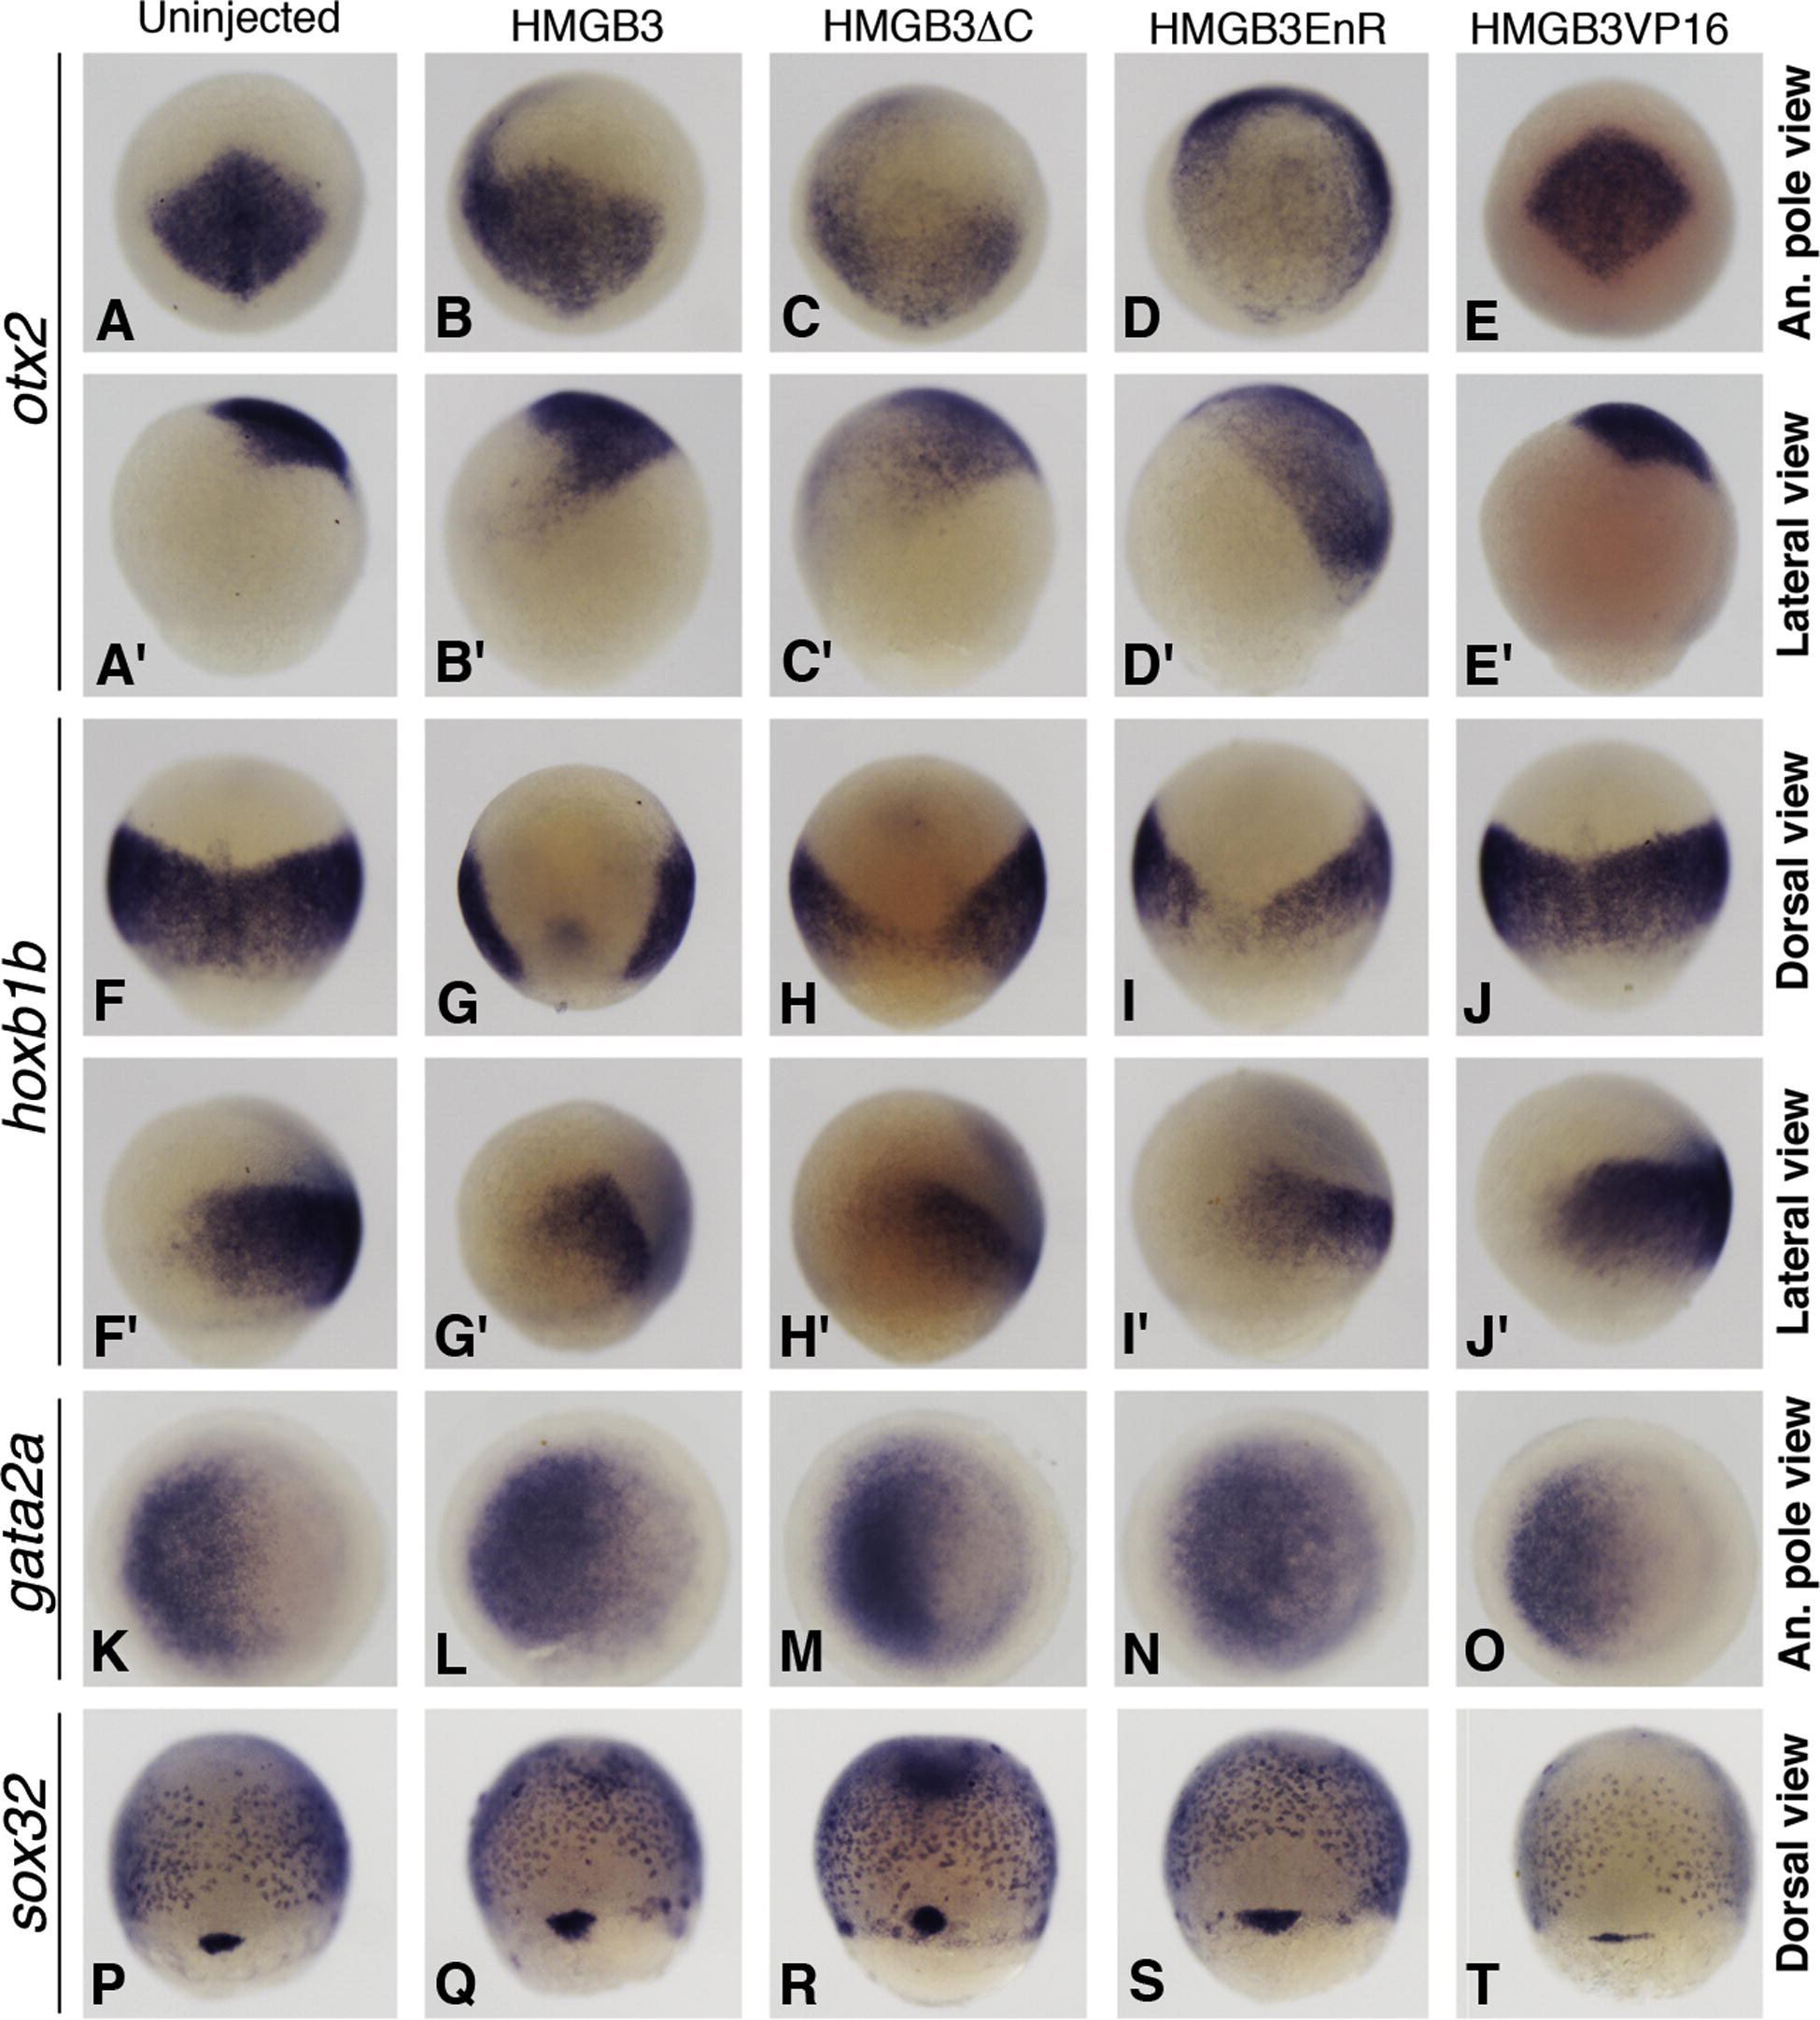
Fig. 5 Expression of ectoderm, neuroectoderm and endoderm markers in embryos overexpressing hmgb3 and different mutants. (A-E) Animal pole view of otx2 expression at 80% epiboly in control and injected embryos, as indicated on the top. (A′-E′) Lateral view of the same embryos as in A–E. (F-J) Dorsal view of hoxb1b expression at 80% epiboly in control and injected embryos. (F′-J′) Lateral view of the same embryos as in F–J, dorsal region is to the right. (K-L) Animal pole view of gata2a expression at 50% epiboly in control and injected embryos as indicated on the top, dorsal is to the right. (P-T) Dorsal view of sox32 expression at 75% epiboly in control and injected embryos as indicated on the top.
Reprinted from Mechanisms of Development, 129(9-12), Cao, J.M., Li, S.Q., Zhang, H.W., and Shi, D.L., High mobility group B proteins regulate mesoderm formation and dorsoventral patterning during zebrafish and Xenopus early development, 263-274, Copyright (2012) with permission from Elsevier. Full text @ Mech. Dev.