
|
Fig. S4
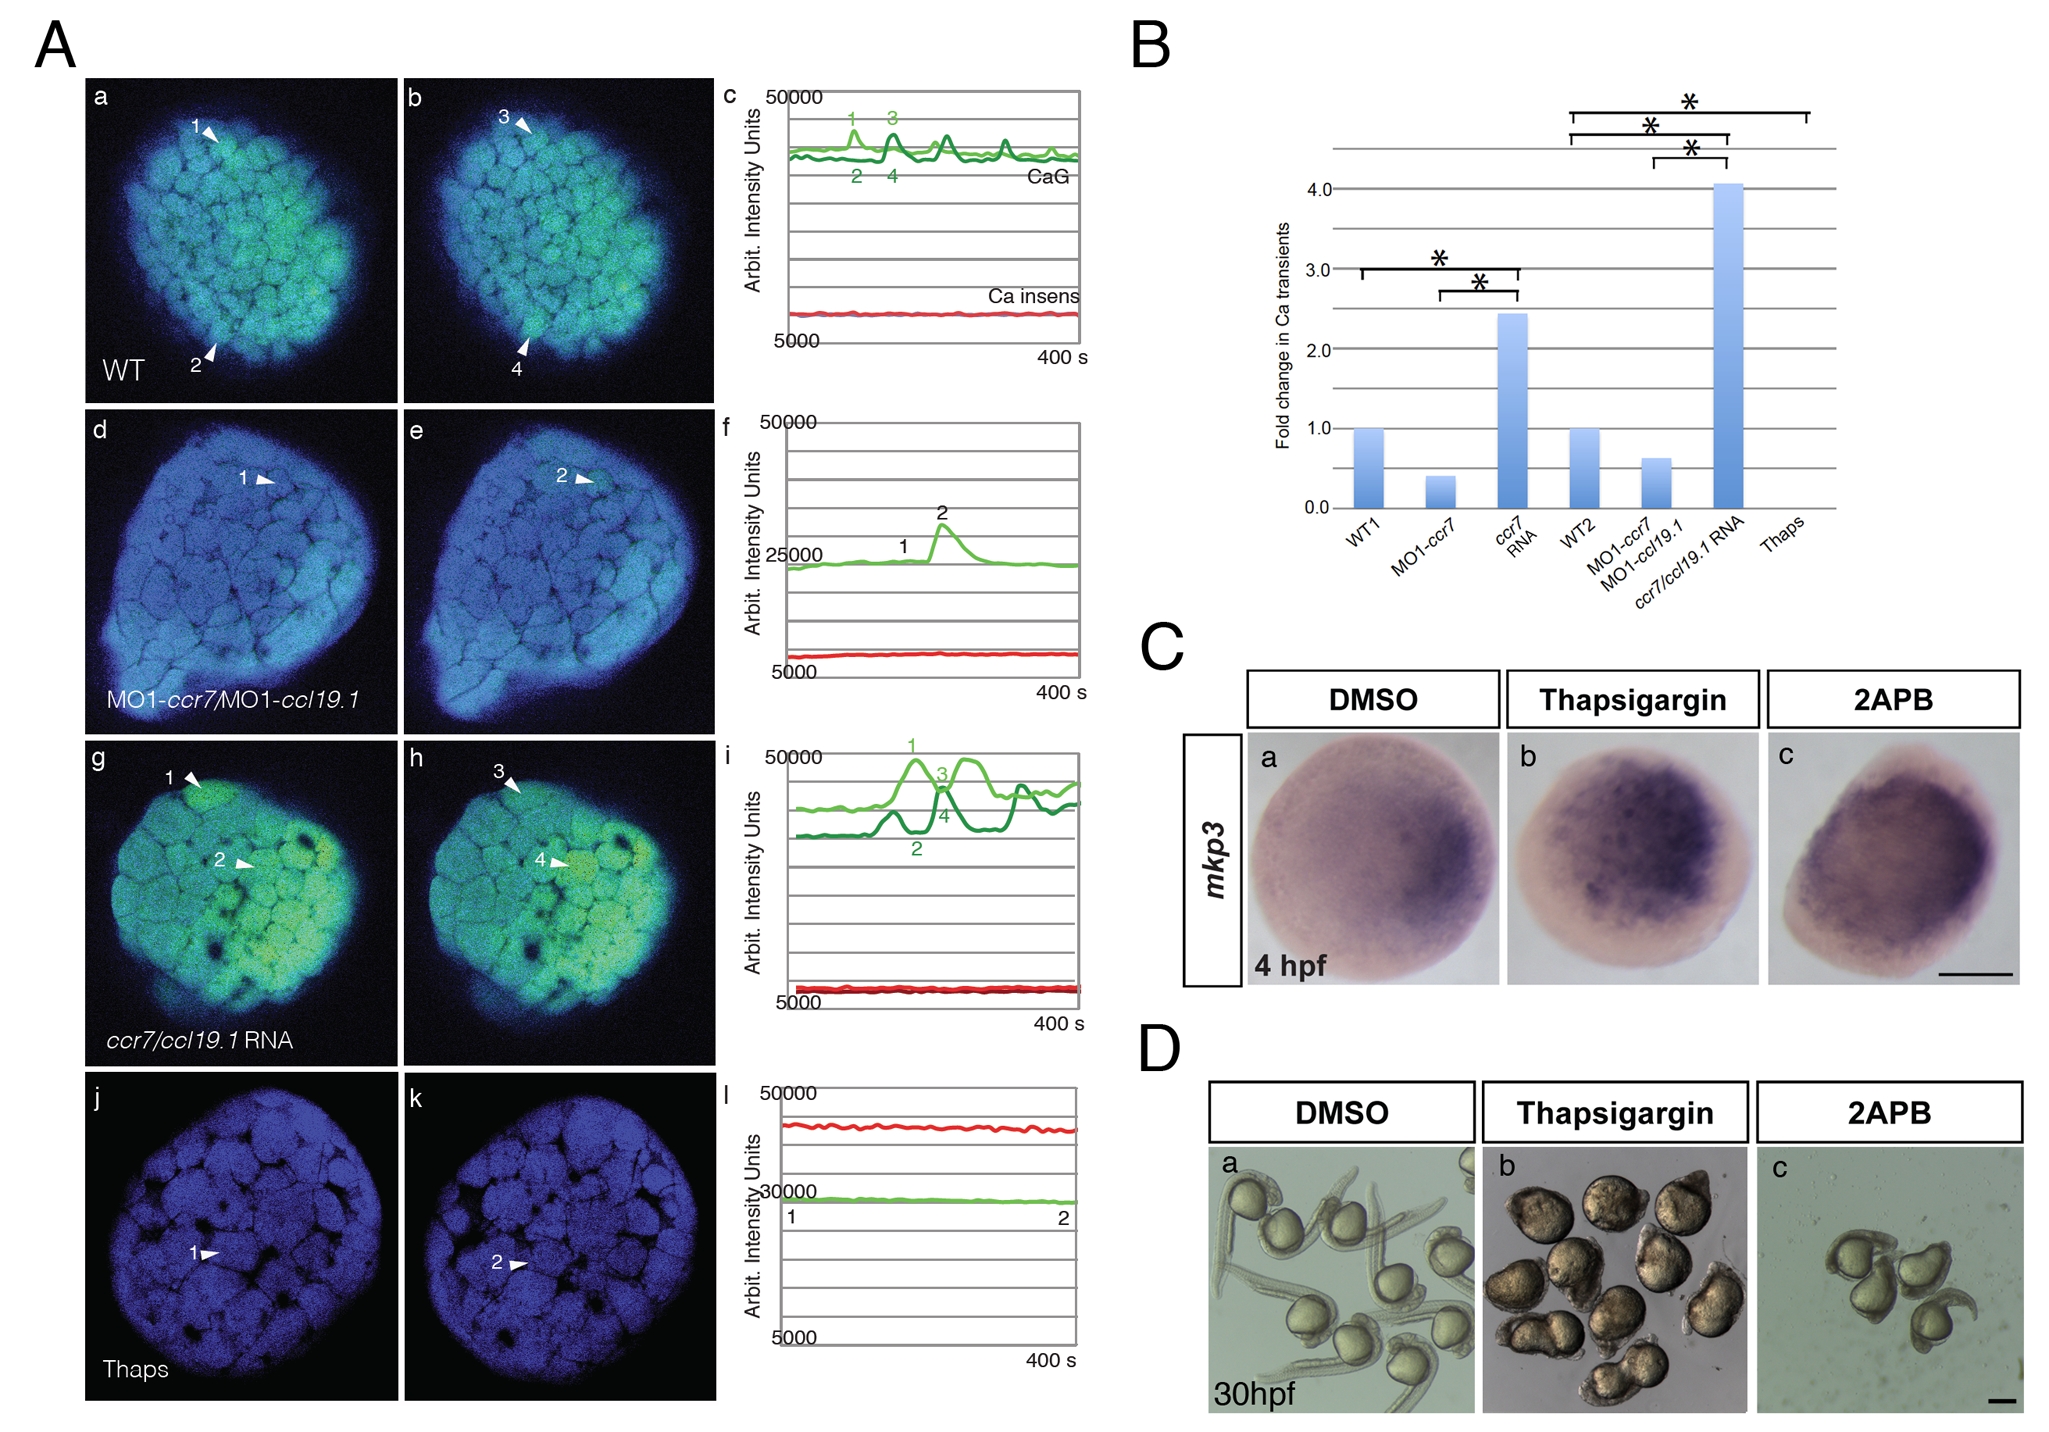
Effects of ccr7 and thapsigargin on Ca2+ transients in superficial blastomeres. (A) Examples of Ca2+ transients at about 256-cell stage in ratiometric images (minimum calcium ratio is 0, maximum is 10). (a) In WT embryo, arrowheads point out increased Ca2+ level at near time points (still images). Note the rapid changes of Ca2+ peaks (compare a to b, which is 35 s later). (c) The average pixel intensity for the Ca2+ sensitive dye, Calcium Green-1 dextran (green) is shown for the cells (numbered arrowheads) and for the Ca2+ insensitive Tetramethyl Rhodamine dextran (red and black) over a 400 s/50 frame time period. (d, e, f) In MO1-ccr7/MO1-ccl19.1-injected embryos, one cell exhibits a Ca2+ transient at 35 s interval. (g, h, i) In ccr7/ccl19.1 RNA-injected embryo, one cell showed Ca2+ transient over 30 s interval. (j, k, l) In thapsigargin-treated embryos no Ca2+ transients were observed over 400 s interval. (B) Number of Ca2+ transients normalized to mean for WT. Injection of MO1-ccr7 and ccr7 RNA were normalized to WT1 group. Injection of MO1-ccr7/MO1-ccl19.1 and ccr7/ccl19.1 RNA were normalized to WT2 group. * p<0.05. (C) mkp3 expression at 4 hpf in WT embryos (a) treated with 4 μM thapsigargin (b) and 50 μM 2-APB (c). (D) Images of control embryos (a) and embryos treated at cleavage stages with thapsigargin (b) or 2APB (c) at 30 hpf.